Estimated Value: $86,000 - $183,000
--
Bed
--
Bath
984
Sq Ft
$144/Sq Ft
Est. Value
About This Home
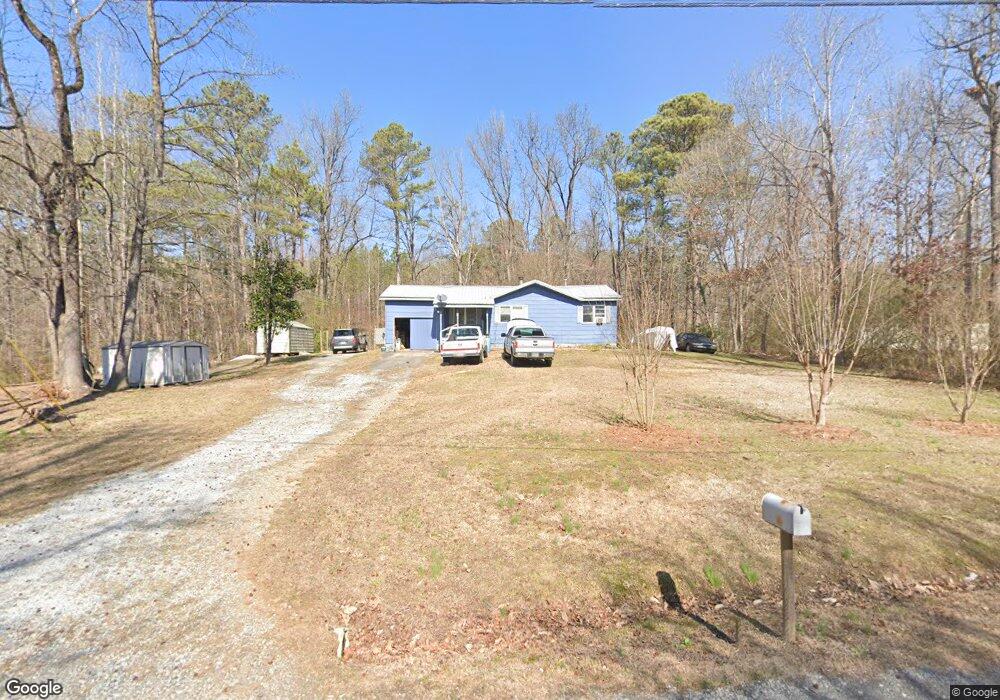
This home is located at 4 Lindsey Ln NW, Rome, GA 30165 and is currently estimated at $141,750, approximately $144 per square foot. 4 Lindsey Ln NW is a home located in Floyd County with nearby schools including Coosa Middle School and Coosa High School.
Ownership History
Date
Name
Owned For
Owner Type
Purchase Details
Closed on
Apr 14, 1988
Sold by
Adkins Jack Jordan and Linda Diane Adkins
Bought by
Blalock David M and Blalock Jessica
Current Estimated Value
Purchase Details
Closed on
Feb 2, 1983
Sold by
Akins Marvin H and Winters Gene W
Bought by
Jordan Adkins Jack and Adkins Linda Diane
Purchase Details
Closed on
Apr 16, 1982
Sold by
Timms Billy
Bought by
Akins Marvin H and Winters Gene W
Purchase Details
Closed on
Mar 1, 1982
Sold by
Hall Harrison H
Bought by
Timms Billy
Purchase Details
Closed on
Feb 21, 1981
Bought by
P and R
Purchase Details
Closed on
Feb 20, 1981
Bought by
P and R
Purchase Details
Closed on
Aug 12, 1978
Sold by
Bobannon Larry and Bobannon Martha
Bought by
Edwards Lester H and Edwards Helen M
Purchase Details
Closed on
Jan 9, 1976
Sold by
Webb Billy Joe
Bought by
Bobannon Larry and Bobannon Martha
Purchase Details
Closed on
Aug 4, 1975
Sold by
Edwards Michael
Bought by
Webb Billy Joe
Purchase Details
Closed on
Feb 20, 1974
Bought by
Edwards Michael
Create a Home Valuation Report for This Property
The Home Valuation Report is an in-depth analysis detailing your home's value as well as a comparison with similar homes in the area
Home Values in the Area
Average Home Value in this Area
Purchase History
| Date | Buyer | Sale Price | Title Company |
|---|---|---|---|
| Blalock David M | $23,200 | -- | |
| Jordan Adkins Jack | $20,900 | -- | |
| Akins Marvin H | $15,000 | -- | |
| Timms Billy | $2,800 | -- | |
| Hall Harrison H | $1,200 | -- | |
| P | -- | -- | |
| P | -- | -- | |
| Edwards Lester H | $18,500 | -- | |
| Bobannon Larry | $2,500 | -- | |
| Webb Billy Joe | $2,500 | -- | |
| Edwards Michael | $1,000 | -- |
Source: Public Records
Tax History Compared to Growth
Tax History
| Year | Tax Paid | Tax Assessment Tax Assessment Total Assessment is a certain percentage of the fair market value that is determined by local assessors to be the total taxable value of land and additions on the property. | Land | Improvement |
|---|---|---|---|---|
| 2024 | $156 | $38,237 | $6,740 | $31,497 |
| 2023 | $757 | $36,602 | $5,777 | $30,825 |
| 2022 | $583 | $33,415 | $4,814 | $28,601 |
| 2021 | $664 | $29,772 | $4,814 | $24,958 |
| 2020 | $630 | $27,722 | $3,852 | $23,870 |
| 2019 | $604 | $26,581 | $3,852 | $22,729 |
| 2018 | $584 | $25,388 | $3,852 | $21,536 |
| 2017 | $574 | $24,778 | $3,852 | $20,926 |
| 2016 | $575 | $24,440 | $3,840 | $20,600 |
| 2015 | -- | $25,355 | $3,840 | $21,515 |
| 2014 | -- | $25,355 | $3,840 | $21,515 |
Source: Public Records
Map
Nearby Homes
- 0 Alabama Hwy Unit 10590171
- 0 Alabama Hwy Unit 7635346
- 0 Alabama Hwy Unit 7494552
- 33 Cedar Ln NW
- 31 Cedar Ln NW
- 43 Brownlow Dr NW
- 36 Stargazer Trail NW
- 4813 Alabama Hwy SW
- 10 Nest Dr NW
- 48 Atwood Dr NW
- 4485 Alabama Hwy
- 8 Kayla Dr NW
- 5 Red Fox Dr SW
- 775 Mays Bridge Rd SW
- 1 Ann Dr NW
- 26 Red Fox Dr SW
- 458 Kraftsman Rd SW
- 293 N Avery Rd NW
- 45 Albert Ave NW
- 86 N Avery Rd NW
- 17 Lakewood Dr NW
- 19 Lakewood Dr NW
- 7 Dapple Ln NW
- 3 Lindsey Ln NW
- 8 Lindsey Ln NW
- 5 Lindsey Ln NW
- 21 Lakewood Dr NW
- 10 Lindsey Ln NW
- 0 Lakewood Dr NW Unit 8265883
- 0 Lakewood Dr NW
- 20 Lakewood Dr NW
- 37 Muscadine Ln NW
- 16 Lakewood Dr NW
- 7 Lindsey Ln NW
- 4 Dapple Ln NW
- 11 Dapple Ln NW
- 11 Dapple Ln NW
- 22 Lakewood Dr NW
- 6 Dapple Ln NW
- 20 Muscadine Ln NW