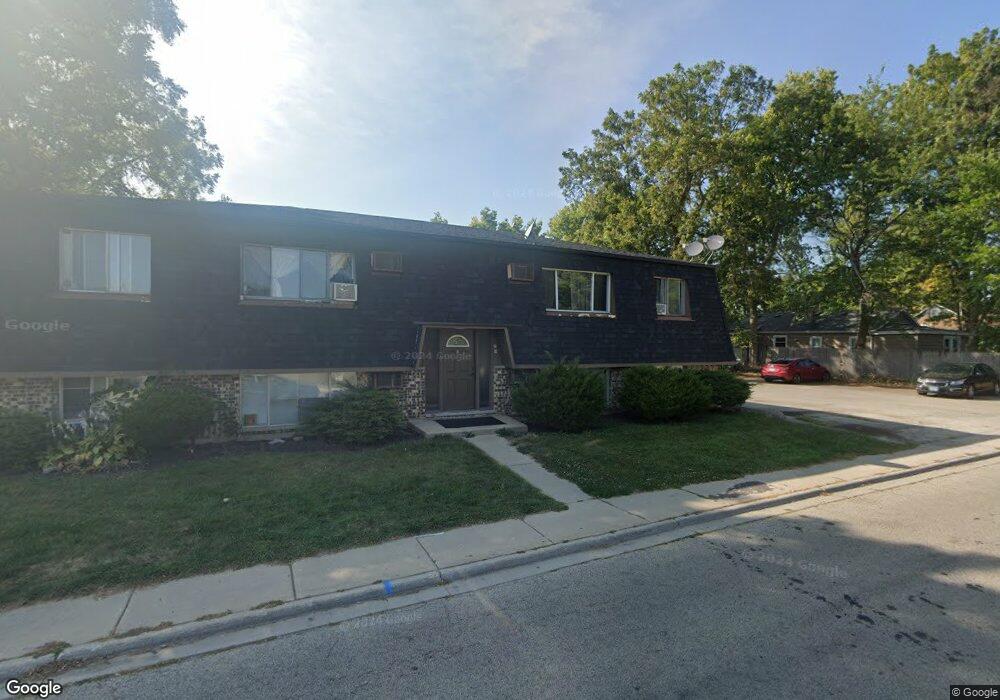
4 Lippincott Rd Unit 1S Fox Lake, IL 60020
Estimated Value: $444,163
2
Beds
1
Bath
725
Sq Ft
$613/Sq Ft
Est. Value
About This Home
This home is located at 4 Lippincott Rd Unit 1S, Fox Lake, IL 60020 and is currently estimated at $444,163, approximately $612 per square foot. 4 Lippincott Rd Unit 1S is a home located in Lake County with nearby schools including Lotus Elementary School, Stanton Middle School, and Grant Community High School.
Ownership History
Date
Name
Owned For
Owner Type
Purchase Details
Closed on
Jan 13, 2021
Sold by
Morales Luis F Ruiz
Bought by
Ruiz Luis F and Ortiz Daniel
Current Estimated Value
Purchase Details
Closed on
May 6, 2019
Sold by
Mcnutt William D
Bought by
Morales Luis F Ruiz
Home Financials for this Owner
Home Financials are based on the most recent Mortgage that was taken out on this home.
Original Mortgage
$245,471
Interest Rate
4.4%
Mortgage Type
FHA
Purchase Details
Closed on
Mar 29, 2013
Sold by
Mcnutt William D and William D Mcnutt Trust
Bought by
Mcnutt William D
Purchase Details
Closed on
Jan 30, 2007
Sold by
Nienajadlo Joseph J and Nienajadlo Olga
Bought by
Mcnutt William D and William D Mcnutt Sr Trust
Home Financials for this Owner
Home Financials are based on the most recent Mortgage that was taken out on this home.
Original Mortgage
$300,000
Interest Rate
6.27%
Mortgage Type
Commercial
Create a Home Valuation Report for This Property
The Home Valuation Report is an in-depth analysis detailing your home's value as well as a comparison with similar homes in the area
Home Values in the Area
Average Home Value in this Area
Purchase History
| Date | Buyer | Sale Price | Title Company |
|---|---|---|---|
| Ruiz Luis F | -- | None Available | |
| Morales Luis F Ruiz | $250,000 | First American Title | |
| Mcnutt William D | -- | None Available | |
| Mcnutt William D | $371,000 | Multiple |
Source: Public Records
Mortgage History
| Date | Status | Borrower | Loan Amount |
|---|---|---|---|
| Previous Owner | Morales Luis F Ruiz | $245,471 | |
| Previous Owner | Mcnutt William D | $300,000 |
Source: Public Records
Tax History Compared to Growth
Tax History
| Year | Tax Paid | Tax Assessment Tax Assessment Total Assessment is a certain percentage of the fair market value that is determined by local assessors to be the total taxable value of land and additions on the property. | Land | Improvement |
|---|---|---|---|---|
| 2024 | $10,430 | $126,170 | $21,028 | $105,142 |
| 2023 | $9,526 | $118,860 | $19,810 | $99,050 |
| 2022 | $9,526 | $104,710 | $20,336 | $84,374 |
| 2021 | $9,082 | $96,957 | $17,426 | $79,531 |
| 2020 | $9,103 | $95,571 | $17,177 | $78,394 |
| 2019 | $8,869 | $93,478 | $18,302 | $75,176 |
| 2018 | $8,455 | $88,236 | $18,026 | $70,210 |
| 2017 | $8,267 | $81,556 | $16,661 | $64,895 |
| 2016 | $8,346 | $74,590 | $15,238 | $59,352 |
| 2015 | $9,720 | $84,992 | $14,220 | $70,772 |
| 2014 | $7,721 | $70,579 | $14,149 | $56,430 |
| 2012 | $7,013 | $72,390 | $14,743 | $57,647 |
Source: Public Records
Map
Nearby Homes
- 43 Lippincott Rd
- 8 S Lake Ave
- 50 N Lake Ave
- 29 S Hickory Ave
- 10 S Maple Ave
- 38 S Maple Ave
- 37 Hillcrest Ave
- 9 Lakeside Ln
- 127 E Grand Ave
- 69 Washington St
- 314 Mastodon Dr
- 35 Medinah Ave
- 21 Hillside Dr
- 541 Foxridge Dr Unit 13D
- 85 Woodhills Bay Rd Unit 85
- 605 Rollins Rd
- 616 Windsor Dr Unit D
- 36379 N Wesley Rd
- 71 White Oaks Rd Unit 71
- 0 Channel Dr
- 4 Lippincott Rd
- 8 Lippincott Rd
- 248 E Grand Ave
- 10 Lippincott Rd
- 3 Lippincott Rd
- 7 N Poplar Ave
- 1 Hawthorne Ln
- 12 Lippincott Rd
- 11 Lippincott Rd
- 14 Lippincott Rd
- 13 Lippincott Rd
- 13 N Poplar Ave
- 239 E Grand Ave
- 257 Orchard Place
- 256 E Grand Ave
- 16 Lippincott Rd
- 237 E Grand Ave
- 259 Orchard Place
- 18 Lippincott Rd
- 10 N Poplar Ave