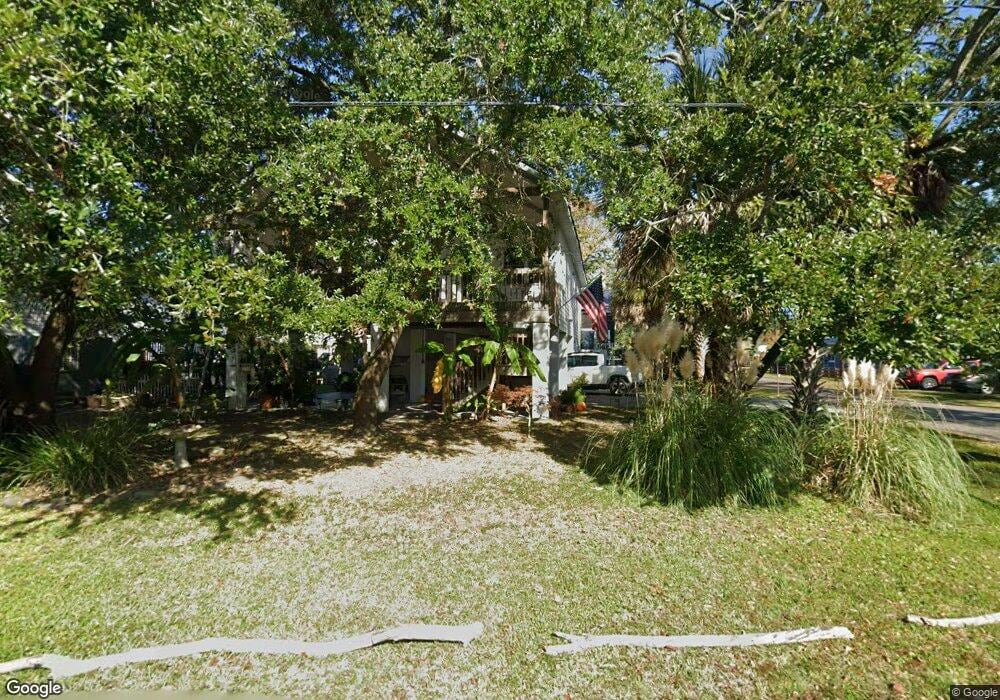
4 Logan St Tybee Island, GA 31328
Estimated Value: $644,000 - $740,000
3
Beds
2
Baths
1,600
Sq Ft
$443/Sq Ft
Est. Value
About This Home
This home is located at 4 Logan St, Tybee Island, GA 31328 and is currently estimated at $708,554, approximately $442 per square foot. 4 Logan St is a home with nearby schools including Howard Elementary School, Coastal Middle School, and Islands High School.
Ownership History
Date
Name
Owned For
Owner Type
Purchase Details
Closed on
Mar 4, 2011
Sold by
Byrd Ewell S
Bought by
Rushing Byrd Iii Ewell S and Rushing Byrd Gina
Current Estimated Value
Home Financials for this Owner
Home Financials are based on the most recent Mortgage that was taken out on this home.
Original Mortgage
$250,000
Outstanding Balance
$7,712
Interest Rate
4.77%
Mortgage Type
New Conventional
Estimated Equity
$700,842
Create a Home Valuation Report for This Property
The Home Valuation Report is an in-depth analysis detailing your home's value as well as a comparison with similar homes in the area
Home Values in the Area
Average Home Value in this Area
Purchase History
| Date | Buyer | Sale Price | Title Company |
|---|---|---|---|
| Rushing Byrd Iii Ewell S | -- | -- | |
| Rushing Byrd Ewell S | -- | -- |
Source: Public Records
Mortgage History
| Date | Status | Borrower | Loan Amount |
|---|---|---|---|
| Open | Rushing Byrd Ewell S | $250,000 |
Source: Public Records
Tax History Compared to Growth
Tax History
| Year | Tax Paid | Tax Assessment Tax Assessment Total Assessment is a certain percentage of the fair market value that is determined by local assessors to be the total taxable value of land and additions on the property. | Land | Improvement |
|---|---|---|---|---|
| 2025 | $3,340 | $294,840 | $157,520 | $137,320 |
| 2024 | $3,340 | $295,800 | $157,520 | $138,280 |
| 2023 | $2,707 | $275,360 | $157,520 | $117,840 |
| 2022 | $3,038 | $231,000 | $115,520 | $115,480 |
| 2021 | $3,008 | $185,480 | $52,680 | $132,800 |
| 2020 | $3,047 | $164,720 | $52,680 | $112,040 |
| 2019 | $3,047 | $164,720 | $52,680 | $112,040 |
| 2018 | $3,004 | $160,680 | $52,680 | $108,000 |
| 2017 | $2,700 | $162,680 | $52,680 | $110,000 |
| 2016 | $2,661 | $161,440 | $52,680 | $108,760 |
| 2014 | $3,846 | $124,120 | $0 | $0 |
Source: Public Records
Map
Nearby Homes
- 817 1st St Unit B-3
- 5 5th Ave
- 106 Eagles Nest Dr
- 703 1st St
- 5 Lighthouse Ln Unit A
- 0 5th Ave Unit SA342444
- 20 Van Horne Ave
- 21 Officers Row
- 18 Van Horne Ave
- 0 Veterans Dr
- 1 Carpenter Rd
- 3 Palmwood Ct
- 12 Village Place Unit B
- 8 Driftwood Ct
- 905 Mortar Ave
- 130 Lewis Ave
- 204 5th Ave
- 113 Jones Ave
- 115 Jones Ave
- 111 2nd Ave