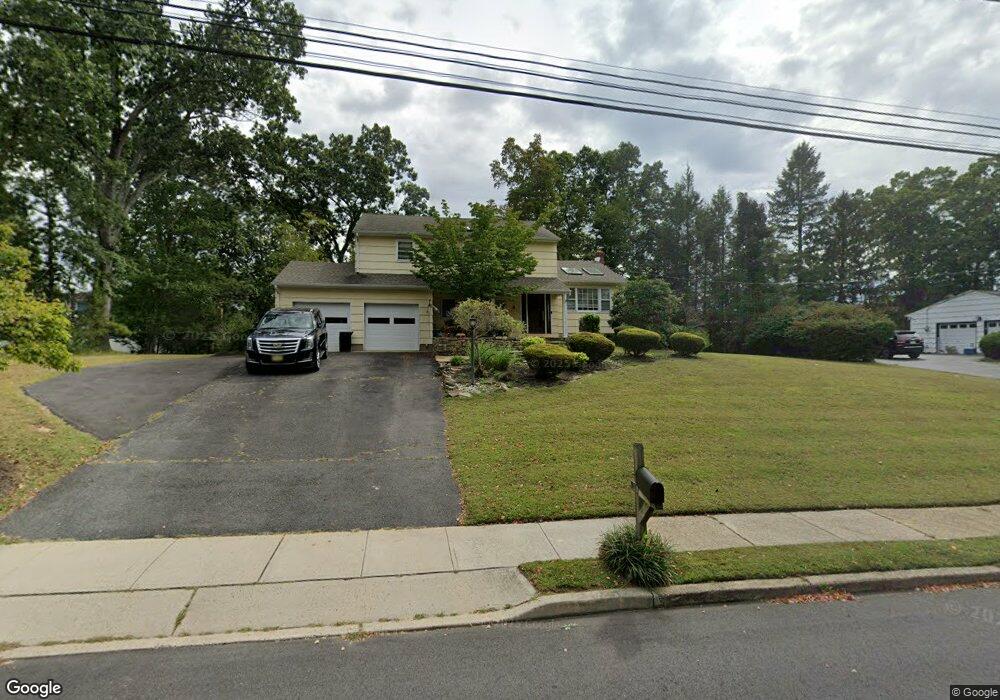
4 Lori Ln Howell, NJ 07731
Winston Park NeighborhoodEstimated Value: $672,000 - $736,000
4
Beds
3
Baths
2,168
Sq Ft
$323/Sq Ft
Est. Value
About This Home
This home is located at 4 Lori Ln, Howell, NJ 07731 and is currently estimated at $700,627, approximately $323 per square foot. 4 Lori Ln is a home located in Monmouth County with nearby schools including Taunton School, Aldrich School, and Howell Township Middle School South.
Ownership History
Date
Name
Owned For
Owner Type
Purchase Details
Closed on
May 31, 2001
Sold by
Shaw Kevin
Bought by
Mcleod Craig and Mcleod Frances
Current Estimated Value
Home Financials for this Owner
Home Financials are based on the most recent Mortgage that was taken out on this home.
Original Mortgage
$249,375
Outstanding Balance
$95,061
Interest Rate
7.15%
Estimated Equity
$605,566
Purchase Details
Closed on
Jun 23, 1995
Sold by
Thompson Timothy
Bought by
Shaw Kevin and Shaw Tammy
Home Financials for this Owner
Home Financials are based on the most recent Mortgage that was taken out on this home.
Original Mortgage
$147,000
Interest Rate
7.8%
Create a Home Valuation Report for This Property
The Home Valuation Report is an in-depth analysis detailing your home's value as well as a comparison with similar homes in the area
Home Values in the Area
Average Home Value in this Area
Purchase History
| Date | Buyer | Sale Price | Title Company |
|---|---|---|---|
| Mcleod Craig | $262,500 | -- | |
| Shaw Kevin | $162,000 | -- |
Source: Public Records
Mortgage History
| Date | Status | Borrower | Loan Amount |
|---|---|---|---|
| Open | Mcleod Craig | $249,375 | |
| Previous Owner | Shaw Kevin | $147,000 |
Source: Public Records
Tax History Compared to Growth
Tax History
| Year | Tax Paid | Tax Assessment Tax Assessment Total Assessment is a certain percentage of the fair market value that is determined by local assessors to be the total taxable value of land and additions on the property. | Land | Improvement |
|---|---|---|---|---|
| 2025 | $9,230 | $527,200 | $277,000 | $250,200 |
| 2024 | $9,286 | $520,000 | $252,000 | $268,000 |
| 2023 | $9,286 | $498,700 | $237,000 | $261,700 |
| 2022 | $9,148 | $426,200 | $177,000 | $249,200 |
| 2021 | $9,148 | $398,600 | $177,000 | $221,600 |
| 2020 | $9,209 | $396,100 | $177,000 | $219,100 |
| 2019 | $9,063 | $382,400 | $167,000 | $215,400 |
| 2018 | $8,655 | $363,500 | $158,200 | $205,300 |
| 2017 | $8,607 | $357,300 | $158,200 | $199,100 |
| 2016 | $8,448 | $346,100 | $152,000 | $194,100 |
| 2015 | $8,310 | $337,100 | $148,000 | $189,100 |
| 2014 | $8,069 | $303,700 | $153,400 | $150,300 |
Source: Public Records
Map
Nearby Homes