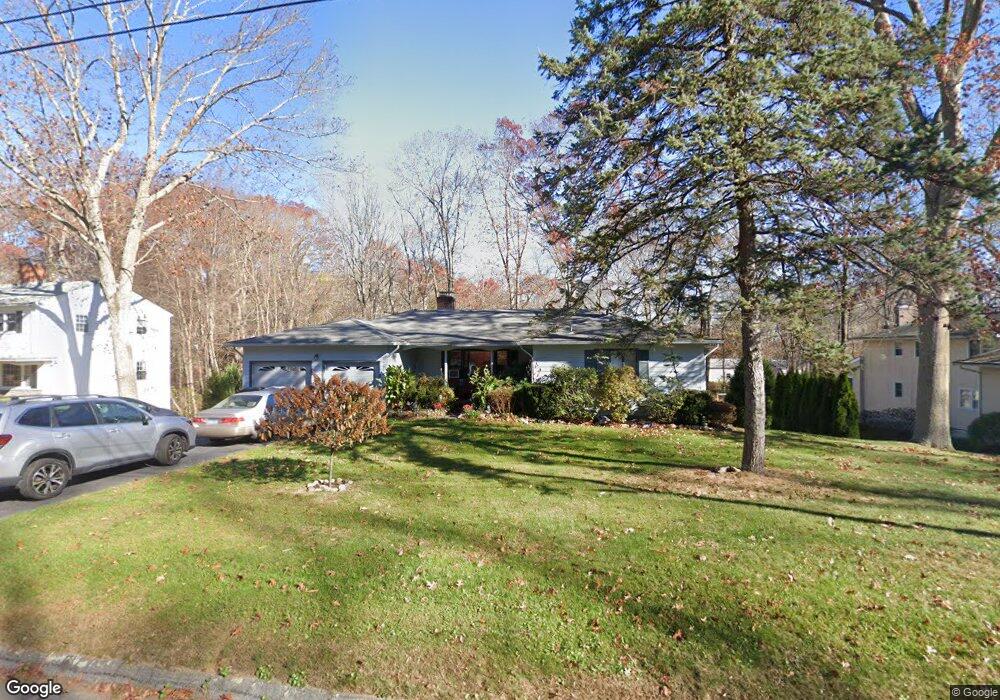
4 Louise Dr Niantic, CT 06357
Estimated Value: $560,000 - $626,000
5
Beds
3
Baths
1,520
Sq Ft
$381/Sq Ft
Est. Value
About This Home
This home is located at 4 Louise Dr, Niantic, CT 06357 and is currently estimated at $579,548, approximately $381 per square foot. 4 Louise Dr is a home located in New London County with nearby schools including East Lyme Middle School, East Lyme High School, and The Light House Voc-Ed Center.
Ownership History
Date
Name
Owned For
Owner Type
Purchase Details
Closed on
Jun 30, 1997
Sold by
Frycki Kevin C
Bought by
Carlson Jeffrey and Rollins Jacqueline
Current Estimated Value
Purchase Details
Closed on
Dec 20, 1993
Sold by
Weigel John E
Bought by
Frycki Kevin C and Frycki Lorraine
Purchase Details
Closed on
Feb 13, 1990
Sold by
Damato Milford Ltd
Bought by
Pettini Alvin E
Create a Home Valuation Report for This Property
The Home Valuation Report is an in-depth analysis detailing your home's value as well as a comparison with similar homes in the area
Home Values in the Area
Average Home Value in this Area
Purchase History
| Date | Buyer | Sale Price | Title Company |
|---|---|---|---|
| Carlson Jeffrey | $160,000 | -- | |
| Frycki Kevin C | $136,000 | -- | |
| Pettini Alvin E | $169,000 | -- |
Source: Public Records
Mortgage History
| Date | Status | Borrower | Loan Amount |
|---|---|---|---|
| Closed | Pettini Alvin E | $119,000 | |
| Closed | Pettini Alvin E | $143,888 | |
| Closed | Pettini Alvin E | $153,600 |
Source: Public Records
Tax History
| Year | Tax Paid | Tax Assessment Tax Assessment Total Assessment is a certain percentage of the fair market value that is determined by local assessors to be the total taxable value of land and additions on the property. | Land | Improvement |
|---|---|---|---|---|
| 2025 | $6,784 | $242,200 | $86,030 | $156,170 |
| 2024 | $6,382 | $242,200 | $86,030 | $156,170 |
| 2023 | $6,026 | $242,200 | $86,030 | $156,170 |
| 2022 | $5,774 | $242,200 | $86,030 | $156,170 |
| 2021 | $5,169 | $181,300 | $77,840 | $103,460 |
| 2020 | $5,142 | $181,300 | $77,840 | $103,460 |
| 2019 | $5,111 | $181,300 | $77,840 | $103,460 |
| 2018 | $4,959 | $181,300 | $77,840 | $103,460 |
| 2017 | $4,743 | $181,300 | $77,840 | $103,460 |
| 2016 | $4,708 | $185,640 | $81,970 | $103,670 |
| 2015 | $4,587 | $185,640 | $81,970 | $103,670 |
| 2014 | $4,451 | $185,220 | $81,970 | $103,250 |
Source: Public Records
Map
Nearby Homes
- 19 Sapia Dr
- 12 Spinnaker Dr
- 31 Regatta Dr
- 97 W Main St Unit 36
- 55 Corey Ln
- 127 Black Point Rd Unit 7
- 43 Roxbury Ct
- 47 Village Crossing Unit 47
- 46 Village Crossing Unit 46
- 26 Mohawk Dr
- 42 S Washington Ave
- 43 Village Crossing Unit 43
- 36 Attawan Rd
- 37 Stoneywood Dr
- 468 Main St Unit 318
- 82 Roxbury Rd
- 80 Roxbury Rd
- 15 Griswold Rd
- 15 Freedom Way Unit 105
- 15 Freedom Way Unit 92
Your Personal Tour Guide
Ask me questions while you tour the home.