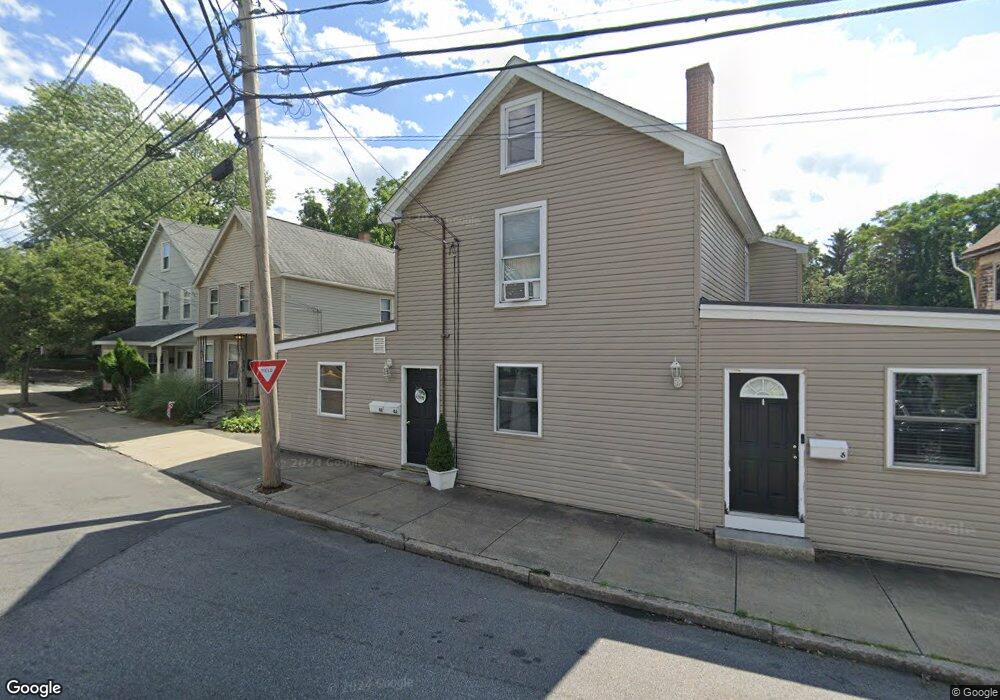
4 Lowell St Woburn, MA 01801
Downtown Woburn NeighborhoodEstimated Value: $766,561 - $874,000
3
Beds
3
Baths
2,408
Sq Ft
$335/Sq Ft
Est. Value
About This Home
This home is located at 4 Lowell St, Woburn, MA 01801 and is currently estimated at $806,140, approximately $334 per square foot. 4 Lowell St is a home located in Middlesex County with nearby schools including Wyman Elementary School, John F. Kennedy Middle School, and Woburn High School.
Ownership History
Date
Name
Owned For
Owner Type
Purchase Details
Closed on
Jun 24, 2025
Sold by
Tremblay John
Bought by
658 Main Street Rt and Tocci
Current Estimated Value
Home Financials for this Owner
Home Financials are based on the most recent Mortgage that was taken out on this home.
Original Mortgage
$581,250
Outstanding Balance
$579,743
Interest Rate
6.76%
Mortgage Type
Purchase Money Mortgage
Estimated Equity
$226,397
Purchase Details
Closed on
Oct 17, 2005
Sold by
Day Paul
Bought by
Tremblay John
Home Financials for this Owner
Home Financials are based on the most recent Mortgage that was taken out on this home.
Original Mortgage
$220,500
Interest Rate
5.78%
Mortgage Type
Purchase Money Mortgage
Create a Home Valuation Report for This Property
The Home Valuation Report is an in-depth analysis detailing your home's value as well as a comparison with similar homes in the area
Home Values in the Area
Average Home Value in this Area
Purchase History
| Date | Buyer | Sale Price | Title Company |
|---|---|---|---|
| 658 Main Street Rt | $775,000 | None Available | |
| 658 Main Street Rt | $775,000 | None Available | |
| Tremblay John | $245,000 | -- | |
| Tremblay John | $245,000 | -- |
Source: Public Records
Mortgage History
| Date | Status | Borrower | Loan Amount |
|---|---|---|---|
| Open | 658 Main Street Rt | $581,250 | |
| Closed | 658 Main Street Rt | $581,250 | |
| Previous Owner | Tremblay John | $220,500 |
Source: Public Records
Tax History Compared to Growth
Tax History
| Year | Tax Paid | Tax Assessment Tax Assessment Total Assessment is a certain percentage of the fair market value that is determined by local assessors to be the total taxable value of land and additions on the property. | Land | Improvement |
|---|---|---|---|---|
| 2025 | $5,197 | $608,600 | $337,500 | $271,100 |
| 2024 | $4,724 | $586,100 | $321,500 | $264,600 |
| 2023 | $4,754 | $546,400 | $292,300 | $254,100 |
| 2022 | $4,505 | $482,300 | $254,500 | $227,800 |
| 2021 | $4,388 | $470,300 | $242,500 | $227,800 |
| 2020 | $4,078 | $437,500 | $242,500 | $195,000 |
| 2019 | $3,823 | $402,400 | $231,100 | $171,300 |
| 2018 | $3,750 | $379,200 | $212,200 | $167,000 |
| 2017 | $3,436 | $345,700 | $202,300 | $143,400 |
| 2016 | $3,237 | $322,100 | $189,200 | $132,900 |
| 2015 | $3,152 | $309,900 | $177,000 | $132,900 |
| 2014 | $3,139 | $300,700 | $177,000 | $123,700 |
Source: Public Records
Map
Nearby Homes