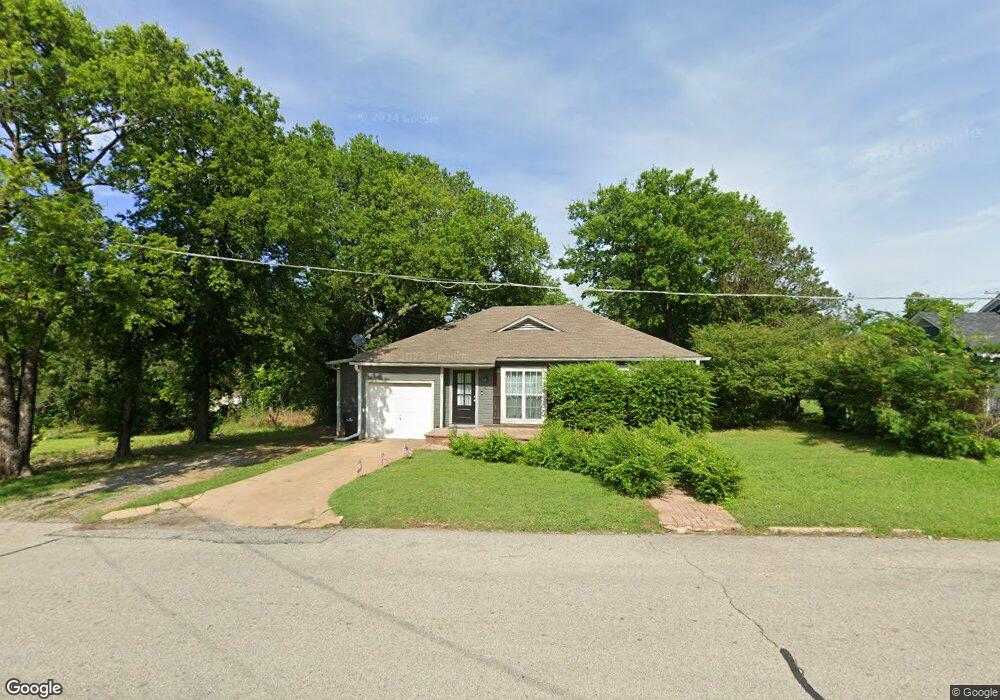
4 Loy Dr Denison, TX 75020
Estimated Value: $170,000 - $170,631
3
Beds
1
Bath
1,130
Sq Ft
$151/Sq Ft
Est. Value
About This Home
This home is located at 4 Loy Dr, Denison, TX 75020 and is currently estimated at $170,316, approximately $150 per square foot. 4 Loy Dr is a home located in Grayson County with nearby schools including Terrell Elementary School, Scott Middle School, and Denison High School.
Ownership History
Date
Name
Owned For
Owner Type
Purchase Details
Closed on
May 28, 2021
Sold by
Clark Justin C
Bought by
Campbell Alexis K
Current Estimated Value
Home Financials for this Owner
Home Financials are based on the most recent Mortgage that was taken out on this home.
Original Mortgage
$132,554
Outstanding Balance
$120,198
Interest Rate
3%
Mortgage Type
FHA
Estimated Equity
$50,118
Purchase Details
Closed on
Nov 6, 2009
Sold by
Atkinson Camille M and Hampton Robert C
Bought by
Clark Justin C
Home Financials for this Owner
Home Financials are based on the most recent Mortgage that was taken out on this home.
Original Mortgage
$42,400
Interest Rate
4.9%
Mortgage Type
New Conventional
Purchase Details
Closed on
Apr 16, 2008
Sold by
Fannie Mae
Bought by
Atkinson Camille M and Hampton Robert C
Home Financials for this Owner
Home Financials are based on the most recent Mortgage that was taken out on this home.
Original Mortgage
$34,200
Interest Rate
6%
Mortgage Type
Purchase Money Mortgage
Create a Home Valuation Report for This Property
The Home Valuation Report is an in-depth analysis detailing your home's value as well as a comparison with similar homes in the area
Home Values in the Area
Average Home Value in this Area
Purchase History
| Date | Buyer | Sale Price | Title Company |
|---|---|---|---|
| Campbell Alexis K | -- | Red River Title Co | |
| Clark Justin C | -- | Chapin Title Co Inc | |
| Atkinson Camille M | -- | Chapin Title Co Inc |
Source: Public Records
Mortgage History
| Date | Status | Borrower | Loan Amount |
|---|---|---|---|
| Open | Campbell Alexis K | $132,554 | |
| Previous Owner | Clark Justin C | $42,400 | |
| Previous Owner | Atkinson Camille M | $34,200 |
Source: Public Records
Tax History Compared to Growth
Tax History
| Year | Tax Paid | Tax Assessment Tax Assessment Total Assessment is a certain percentage of the fair market value that is determined by local assessors to be the total taxable value of land and additions on the property. | Land | Improvement |
|---|---|---|---|---|
| 2025 | $1,498 | $129,902 | -- | -- |
| 2024 | $2,744 | $118,093 | $0 | $0 |
| 2023 | $1,195 | $107,357 | $0 | $0 |
| 2022 | $2,319 | $97,597 | $29,970 | $67,627 |
| 2021 | $1,992 | $78,963 | $21,960 | $57,003 |
| 2020 | $1,741 | $66,007 | $8,280 | $57,727 |
| 2019 | $1,990 | $72,334 | $8,280 | $64,054 |
| 2018 | $1,653 | $59,590 | $8,280 | $51,310 |
| 2017 | $1,461 | $52,227 | $2,880 | $49,347 |
| 2016 | $1,437 | $51,350 | $2,400 | $48,950 |
| 2015 | $815 | $43,624 | $2,400 | $41,224 |
| 2014 | $965 | $43,624 | $2,400 | $41,224 |
Source: Public Records
Map
Nearby Homes
- 25 W Parnell St
- 910 N Houston Ave
- 40 Vaughn Dr
- 401-403 W Elm St
- 46 Vaughn Dr
- 415 W Elm St Unit 415-417
- 409 W Johnson St
- 315 W Walker St
- 503 Martin Luther King St
- 425 W Johnson St
- 205 W Bond St
- 522 N Austin Ave
- 526 W Elm St
- 716 N Rusk Ave
- 117 W Morton St
- 121 W Morton St
- 930 N Mirick Ave
- 105 E Morton St
- 14 Geraldine Ln
- TBD Geraldine Ln
- 2 Loy Dr
- 231 W Morton St
- 28 W Parnell St
- 26 W Parnell St
- 24 W Parnell St
- 3 Loy Dr
- 3 Loy Dr
- 3 Loy Dr
- 30 W Parnell St
- 205 Martin Luther King St
- 20 W Parnell St
- 1 Loy Dr
- 201 Martin Luther King St
- 32 W Parnell St
- TBD Martin Luther King St
- 18 W Parnell St
- 311 Martin Luther King St
- 36 W Parnell St
- 23 W Parnell St
- 21 W Parnell St