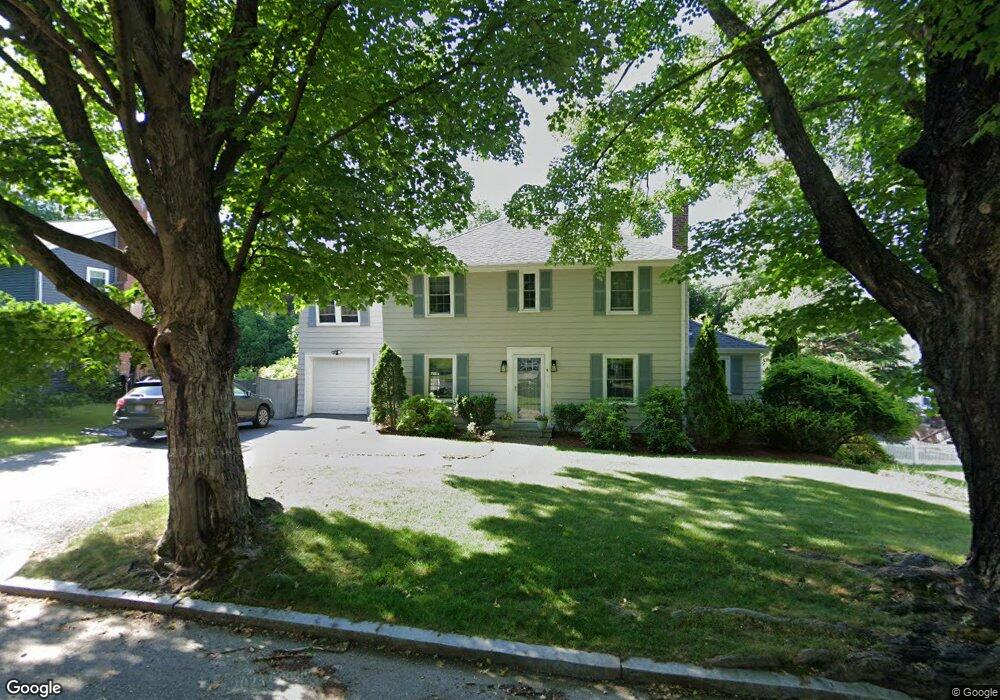
4 Manila St Worcester, MA 01602
Salisbury Street NeighborhoodEstimated Value: $528,000 - $586,000
4
Beds
3
Baths
2,017
Sq Ft
$274/Sq Ft
Est. Value
About This Home
This home is located at 4 Manila St, Worcester, MA 01602 and is currently estimated at $552,198, approximately $273 per square foot. 4 Manila St is a home located in Worcester County with nearby schools including Chandler Magnet, Jacob Hiatt Magnet School, and Midland Street.
Ownership History
Date
Name
Owned For
Owner Type
Purchase Details
Closed on
Aug 15, 2005
Sold by
Herlihy John R and Herlihy Kelly S
Bought by
Irish Anne M and Irish Matthew C
Current Estimated Value
Home Financials for this Owner
Home Financials are based on the most recent Mortgage that was taken out on this home.
Original Mortgage
$304,380
Interest Rate
5.54%
Mortgage Type
Purchase Money Mortgage
Purchase Details
Closed on
Aug 31, 1998
Sold by
Douillard Paul R and Douillard Carol M
Bought by
Herlihy John R and Herlihy Kelly S
Create a Home Valuation Report for This Property
The Home Valuation Report is an in-depth analysis detailing your home's value as well as a comparison with similar homes in the area
Home Values in the Area
Average Home Value in this Area
Purchase History
| Date | Buyer | Sale Price | Title Company |
|---|---|---|---|
| Irish Anne M | $320,400 | -- | |
| Herlihy John R | $170,000 | -- |
Source: Public Records
Mortgage History
| Date | Status | Borrower | Loan Amount |
|---|---|---|---|
| Open | Herlihy John R | $294,373 | |
| Closed | Irish Anne M | $304,380 | |
| Previous Owner | Herlihy John R | $150,000 |
Source: Public Records
Tax History
| Year | Tax Paid | Tax Assessment Tax Assessment Total Assessment is a certain percentage of the fair market value that is determined by local assessors to be the total taxable value of land and additions on the property. | Land | Improvement |
|---|---|---|---|---|
| 2025 | $5,996 | $454,600 | $118,400 | $336,200 |
| 2024 | $5,866 | $426,600 | $118,400 | $308,200 |
| 2023 | $5,644 | $393,600 | $102,900 | $290,700 |
| 2022 | $5,222 | $343,300 | $82,400 | $260,900 |
| 2021 | $5,083 | $312,200 | $65,900 | $246,300 |
| 2020 | $5,022 | $295,400 | $65,900 | $229,500 |
| 2019 | $5,024 | $279,100 | $59,300 | $219,800 |
| 2018 | $4,985 | $263,600 | $59,300 | $204,300 |
| 2017 | $4,784 | $248,900 | $59,300 | $189,600 |
| 2016 | $4,792 | $232,500 | $43,400 | $189,100 |
| 2015 | $4,666 | $232,500 | $43,400 | $189,100 |
| 2014 | $4,543 | $232,500 | $43,400 | $189,100 |
Source: Public Records
Map
Nearby Homes
Your Personal Tour Guide
Ask me questions while you tour the home.