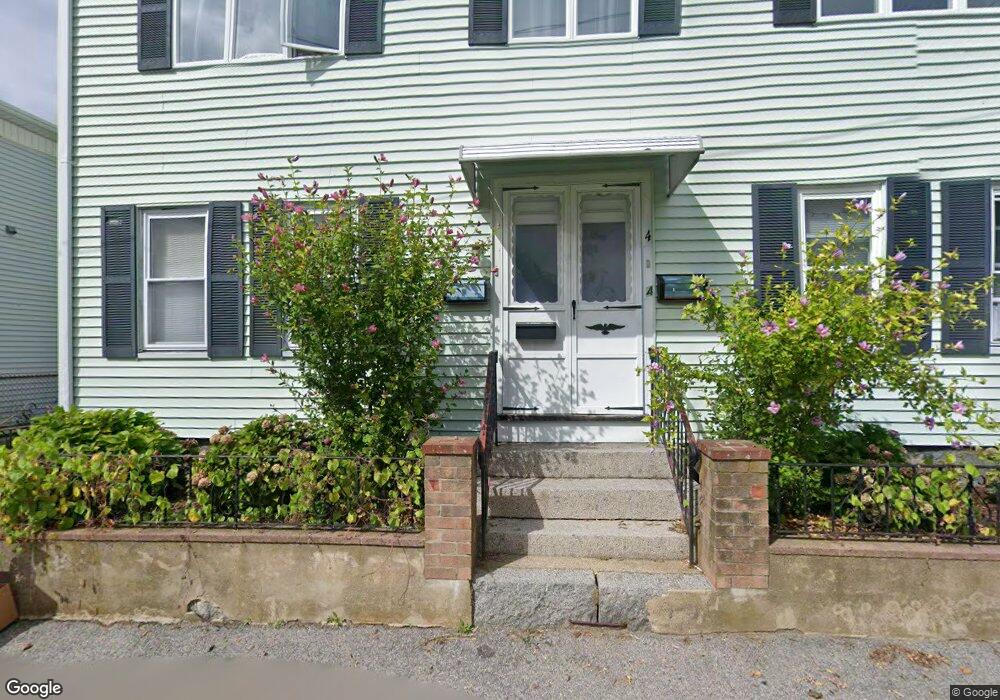
4 Maple St Gloucester, MA 01930
Central Gloucester NeighborhoodEstimated Value: $653,000 - $751,000
7
Beds
3
Baths
2,019
Sq Ft
$351/Sq Ft
Est. Value
About This Home
This home is located at 4 Maple St, Gloucester, MA 01930 and is currently estimated at $708,133, approximately $350 per square foot. 4 Maple St is a home located in Essex County with nearby schools including East Veterans Memorial Elementary, Ralph B O'maley Middle School, and Gloucester High School.
Ownership History
Date
Name
Owned For
Owner Type
Purchase Details
Closed on
Mar 28, 2018
Sold by
Boucher Mary A and Boucher Stephen M
Bought by
Rogers Tyler
Current Estimated Value
Home Financials for this Owner
Home Financials are based on the most recent Mortgage that was taken out on this home.
Original Mortgage
$370,500
Outstanding Balance
$316,797
Interest Rate
4.38%
Mortgage Type
New Conventional
Estimated Equity
$391,336
Purchase Details
Closed on
Jun 3, 2002
Sold by
Lentini Frank and Lentini Maria
Bought by
Boucher Stephen M and Boucher Mary Ann
Home Financials for this Owner
Home Financials are based on the most recent Mortgage that was taken out on this home.
Original Mortgage
$425,000
Interest Rate
7%
Mortgage Type
Purchase Money Mortgage
Purchase Details
Closed on
Jun 23, 1987
Sold by
Figueiredo E P
Bought by
Lentini Frank
Create a Home Valuation Report for This Property
The Home Valuation Report is an in-depth analysis detailing your home's value as well as a comparison with similar homes in the area
Home Values in the Area
Average Home Value in this Area
Purchase History
| Date | Buyer | Sale Price | Title Company |
|---|---|---|---|
| Rogers Tyler | $400,000 | -- | |
| Rogers Tyler | $400,000 | -- | |
| Boucher Stephen M | $290,000 | -- | |
| Boucher Stephen M | $290,000 | -- | |
| Lentini Frank | $195,000 | -- |
Source: Public Records
Mortgage History
| Date | Status | Borrower | Loan Amount |
|---|---|---|---|
| Open | Rogers Tyler | $370,500 | |
| Closed | Rogers Tyler | $370,500 | |
| Previous Owner | Lentini Frank | $284,300 | |
| Previous Owner | Lentini Frank | $331,100 | |
| Previous Owner | Lentini Frank | $425,000 |
Source: Public Records
Tax History
| Year | Tax Paid | Tax Assessment Tax Assessment Total Assessment is a certain percentage of the fair market value that is determined by local assessors to be the total taxable value of land and additions on the property. | Land | Improvement |
|---|---|---|---|---|
| 2025 | $5,086 | $523,200 | $123,300 | $399,900 |
| 2024 | $4,997 | $513,600 | $117,400 | $396,200 |
| 2023 | $5,171 | $488,300 | $104,800 | $383,500 |
| 2022 | $4,867 | $414,900 | $91,200 | $323,700 |
| 2021 | $4,720 | $379,400 | $82,900 | $296,500 |
| 2020 | $4,477 | $363,100 | $82,900 | $280,200 |
| 2019 | $4,170 | $328,600 | $82,900 | $245,700 |
| 2018 | $3,876 | $299,800 | $82,900 | $216,900 |
| 2017 | $3,654 | $277,000 | $74,600 | $202,400 |
| 2016 | $3,532 | $259,500 | $74,600 | $184,900 |
| 2015 | $3,468 | $254,100 | $74,600 | $179,500 |
Source: Public Records
Map
Nearby Homes
- 139A Prospect St
- 19 Trask St Unit 2
- 50 Warner St
- 113 Pleasant St
- 40 Sargent St
- 33 Maplewood Ave Unit 310
- 12 Arthur St
- 9 Cleveland Place
- 191 Main St Unit 3
- 191 Main St Unit 2A
- 36 Eastern Ave
- 98 Maplewood Ave
- 35 Middle St Unit 4
- 33 Middle St
- 120 Washington St
- 8 Mystic Ave
- 13 Mystic Ave
- 3 Mondello Square
- 20 Beacon St
- 20 Beacon St Unit 2
Your Personal Tour Guide
Ask me questions while you tour the home.