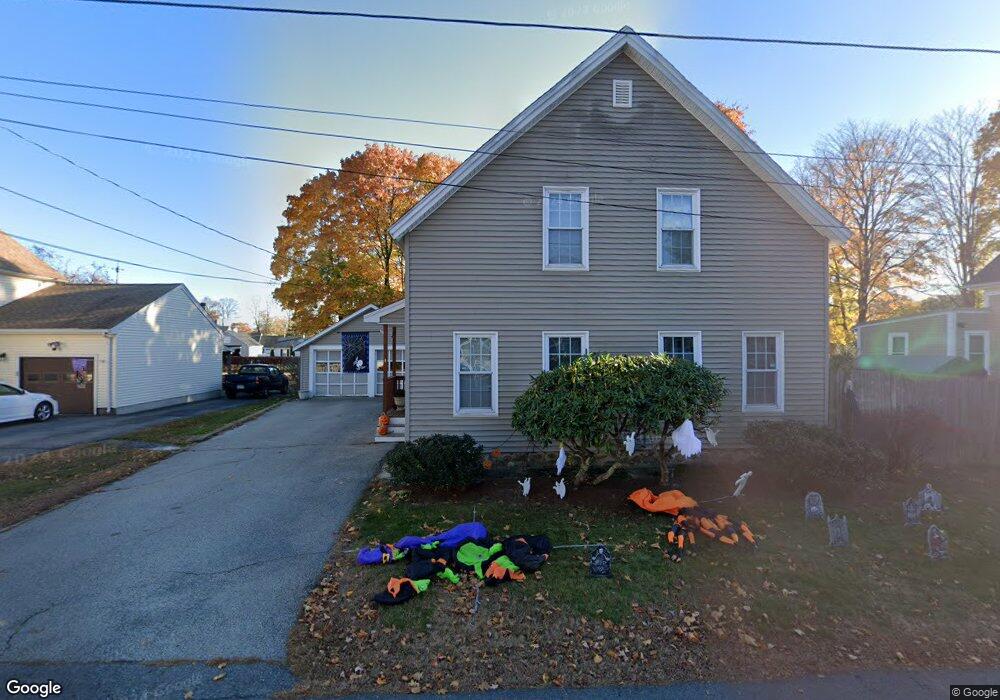
4 Maple St Merrimac, MA 01860
Estimated Value: $528,130 - $671,000
3
Beds
2
Baths
1,600
Sq Ft
$367/Sq Ft
Est. Value
About This Home
This home is located at 4 Maple St, Merrimac, MA 01860 and is currently estimated at $587,783, approximately $367 per square foot. 4 Maple St is a home located in Essex County with nearby schools including Pentucket Regional High School.
Ownership History
Date
Name
Owned For
Owner Type
Purchase Details
Closed on
Dec 11, 1998
Sold by
Eastman Robert J and Eastman Kristy L
Bought by
Christopher Robert J and Christopher Kristine
Current Estimated Value
Purchase Details
Closed on
Jan 23, 1996
Sold by
Catalano Joseph J and Catalano Carole
Bought by
Eastman Robert J and Eastman Kristy
Create a Home Valuation Report for This Property
The Home Valuation Report is an in-depth analysis detailing your home's value as well as a comparison with similar homes in the area
Home Values in the Area
Average Home Value in this Area
Purchase History
| Date | Buyer | Sale Price | Title Company |
|---|---|---|---|
| Christopher Robert J | $148,000 | -- | |
| Eastman Robert J | $126,250 | -- |
Source: Public Records
Mortgage History
| Date | Status | Borrower | Loan Amount |
|---|---|---|---|
| Open | Eastman Robert J | $288,750 | |
| Closed | Eastman Robert J | $19,000 |
Source: Public Records
Tax History
| Year | Tax Paid | Tax Assessment Tax Assessment Total Assessment is a certain percentage of the fair market value that is determined by local assessors to be the total taxable value of land and additions on the property. | Land | Improvement |
|---|---|---|---|---|
| 2025 | $6,772 | $511,100 | $285,600 | $225,500 |
| 2024 | $6,588 | $488,000 | $269,700 | $218,300 |
| 2023 | $6,172 | $417,900 | $228,400 | $189,500 |
| 2022 | $5,869 | $359,200 | $184,000 | $175,200 |
| 2021 | $5,447 | $334,200 | $168,200 | $166,000 |
| 2020 | $4,973 | $334,200 | $168,200 | $166,000 |
| 2019 | $4,743 | $300,000 | $145,900 | $154,100 |
| 2018 | $4,622 | $293,300 | $136,400 | $156,900 |
| 2017 | $4,430 | $271,100 | $114,200 | $156,900 |
| 2016 | $4,266 | $264,000 | $114,200 | $149,800 |
| 2015 | $4,129 | $254,100 | $114,200 | $139,900 |
| 2014 | $3,993 | $251,300 | $114,200 | $137,100 |
Source: Public Records
Map
Nearby Homes
Your Personal Tour Guide
Ask me questions while you tour the home.