4 Margot Ln East Bridgewater, MA 02333
Estimated Value: $786,000 - $1,149,000
5
Beds
4
Baths
3,989
Sq Ft
$257/Sq Ft
Est. Value
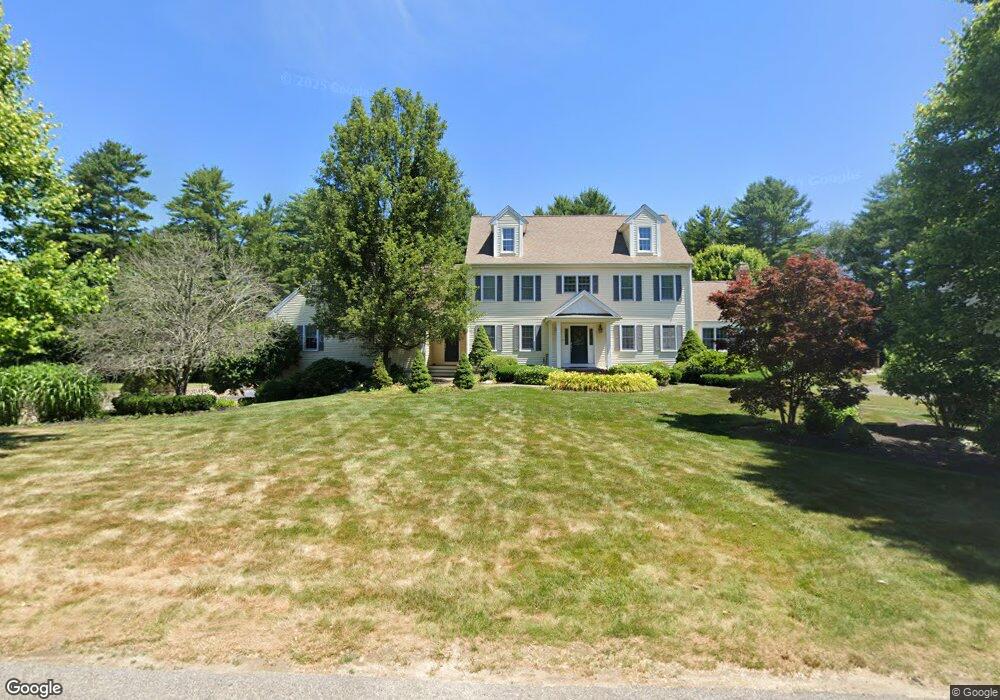
About This Home
This home is located at 4 Margot Ln, East Bridgewater, MA 02333 and is currently estimated at $1,025,198, approximately $257 per square foot. 4 Margot Ln is a home located in Plymouth County with nearby schools including Central Elementary School, Gordon W Mitchell Middle School, and East Bridgewater Jr./Sr. High School.
Ownership History
Date
Name
Owned For
Owner Type
Purchase Details
Closed on
Sep 24, 1999
Sold by
Beatty Barbara I and Beatty Robert J
Bought by
Johnson Edward G
Current Estimated Value
Home Financials for this Owner
Home Financials are based on the most recent Mortgage that was taken out on this home.
Original Mortgage
$160,000
Interest Rate
8.1%
Mortgage Type
Purchase Money Mortgage
Create a Home Valuation Report for This Property
The Home Valuation Report is an in-depth analysis detailing your home's value as well as a comparison with similar homes in the area
Home Values in the Area
Average Home Value in this Area
Purchase History
| Date | Buyer | Sale Price | Title Company |
|---|---|---|---|
| Johnson Edward G | $210,000 | -- |
Source: Public Records
Mortgage History
| Date | Status | Borrower | Loan Amount |
|---|---|---|---|
| Open | Johnson Edward G | $250,000 | |
| Closed | Johnson Edward G | $260,000 | |
| Closed | Johnson Edward G | $300,000 | |
| Closed | Johnson Edward G | $160,000 |
Source: Public Records
Tax History Compared to Growth
Tax History
| Year | Tax Paid | Tax Assessment Tax Assessment Total Assessment is a certain percentage of the fair market value that is determined by local assessors to be the total taxable value of land and additions on the property. | Land | Improvement |
|---|---|---|---|---|
| 2025 | $13,429 | $982,400 | $228,500 | $753,900 |
| 2024 | $13,205 | $954,100 | $219,700 | $734,400 |
| 2023 | $12,846 | $889,000 | $219,700 | $669,300 |
| 2022 | $12,188 | $781,300 | $183,200 | $598,100 |
| 2021 | $155,668 | $700,700 | $176,000 | $524,700 |
| 2020 | $17,463 | $679,900 | $169,200 | $510,700 |
| 2019 | $11,488 | $654,200 | $161,700 | $492,500 |
| 2018 | $5,136 | $635,000 | $161,700 | $473,300 |
| 2017 | $11,172 | $610,500 | $154,300 | $456,200 |
| 2016 | $10,751 | $592,000 | $154,200 | $437,800 |
| 2015 | $10,430 | $587,300 | $153,200 | $434,100 |
| 2014 | $10,088 | $580,800 | $150,000 | $430,800 |
Source: Public Records
Map
Nearby Homes
- 170 Elm St
- 1247 Central St
- 9 Daisy Ln
- 5 Della Way
- 844 Washington St
- 72 Phillips St
- 80 Phillips St
- 936 Central St
- 1054 Main St
- 1 Simmons Place
- 22 Hudson St
- 182 Crystal Water Dr Unit 182
- 1993 Washington St
- 217 Crystal Water Dr
- 51 Stonegate Dr
- 71 Stonegate Dr
- 28 Brookbend Way E
- 78 Crystal Water Dr
- 2045 Washington St
- 587 Bridge St