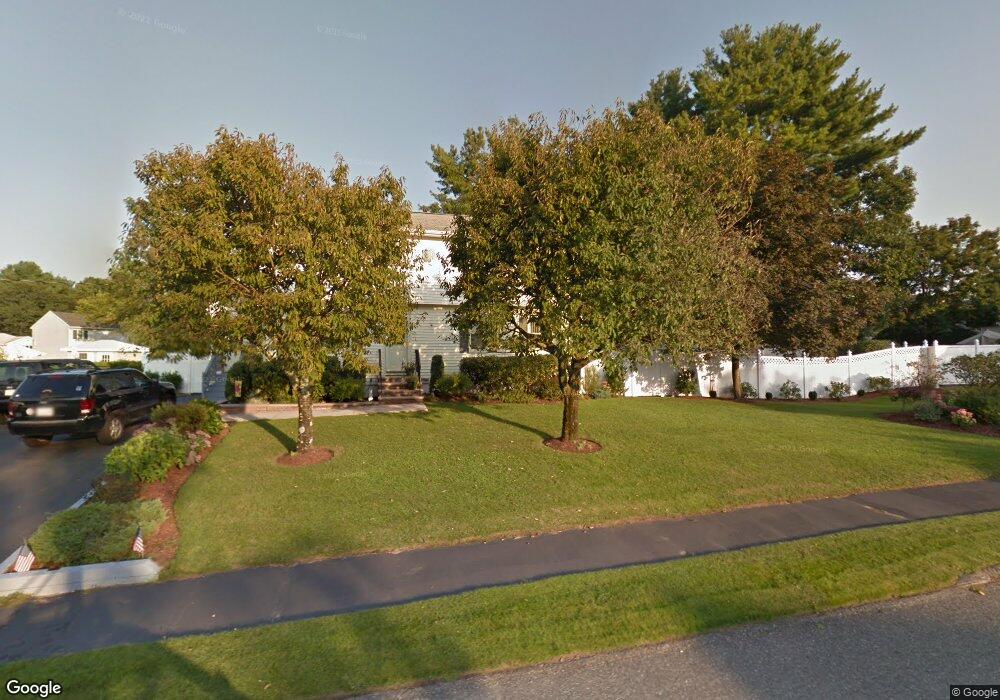
4 Marion Rd Peabody, MA 01960
West Peabody NeighborhoodEstimated Value: $694,000 - $1,196,000
4
Beds
3
Baths
3,428
Sq Ft
$282/Sq Ft
Est. Value
About This Home
This home is located at 4 Marion Rd, Peabody, MA 01960 and is currently estimated at $967,740, approximately $282 per square foot. 4 Marion Rd is a home located in Essex County with nearby schools including Peabody Veterans Memorial High School and Covenant Christian Academy.
Ownership History
Date
Name
Owned For
Owner Type
Purchase Details
Closed on
May 29, 2025
Sold by
Losanno Alfonso and Losanno Teresa M
Bought by
Losanno Ft and Losanno
Current Estimated Value
Purchase Details
Closed on
Jul 31, 1997
Sold by
Monteith Judith
Bought by
Losanno Alfonso and Losanno Teresa M
Create a Home Valuation Report for This Property
The Home Valuation Report is an in-depth analysis detailing your home's value as well as a comparison with similar homes in the area
Home Values in the Area
Average Home Value in this Area
Purchase History
| Date | Buyer | Sale Price | Title Company |
|---|---|---|---|
| Losanno Ft | -- | None Available | |
| Losanno Ft | -- | None Available | |
| Losanno Ft | -- | None Available | |
| Losanno Alfonso | $210,000 | -- | |
| Losanno Alfonso | $210,000 | -- |
Source: Public Records
Mortgage History
| Date | Status | Borrower | Loan Amount |
|---|---|---|---|
| Previous Owner | Losanno Alfonso | $25,000 | |
| Previous Owner | Losanno Alfonso | $115,000 |
Source: Public Records
Tax History
| Year | Tax Paid | Tax Assessment Tax Assessment Total Assessment is a certain percentage of the fair market value that is determined by local assessors to be the total taxable value of land and additions on the property. | Land | Improvement |
|---|---|---|---|---|
| 2025 | $9,172 | $990,500 | $319,700 | $670,800 |
| 2024 | $7,645 | $838,300 | $319,700 | $518,600 |
| 2023 | $7,537 | $791,700 | $266,400 | $525,300 |
| 2022 | $7,252 | $718,000 | $231,700 | $486,300 |
| 2021 | $6,769 | $645,300 | $210,600 | $434,700 |
| 2020 | $7,303 | $680,000 | $210,600 | $469,400 |
| 2019 | $7,051 | $640,400 | $210,600 | $429,800 |
| 2018 | $6,182 | $539,400 | $188,100 | $351,300 |
| 2017 | $4,960 | $421,800 | $188,100 | $233,700 |
| 2016 | $4,695 | $393,900 | $188,100 | $205,800 |
| 2015 | $4,553 | $370,200 | $188,100 | $182,100 |
Source: Public Records
Map
Nearby Homes
- 40 Glen Dr
- 1 Couture Way
- 12 Couture Way
- 23 Hamilton Rd
- 31 Styles Dr
- 24 Worcester Rd
- 19 Peachey Cir
- 6 Cabral Dr
- 35 Catherine Dr
- 1466 Main St
- 8 Temi Rd
- 6 White Ln
- 9 Stableford Ct Unit 9
- 20 Bellingham Ct
- 5 Stableford Ct Unit 11
- 19 Fairway Ln Unit 53
- 37 Peaslee Cir Unit 37
- 67 Fuller Pond Rd
- 15 Fairway Ln Unit 55
- 15 Fairway Ln
Your Personal Tour Guide
Ask me questions while you tour the home.