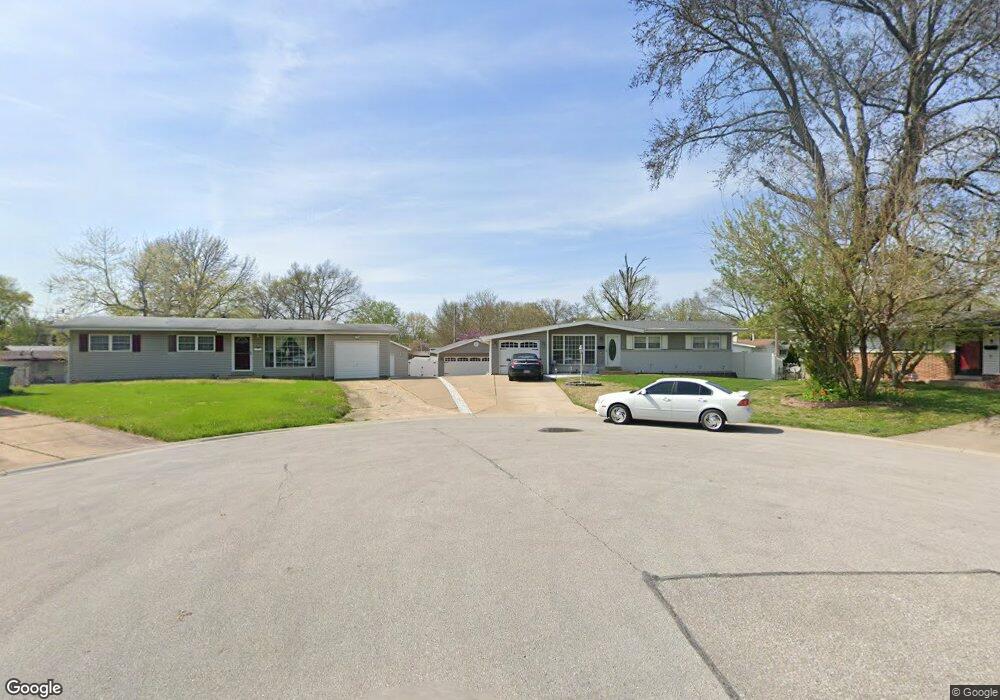
4 Martin Ct Florissant, MO 63033
Estimated Value: $171,000 - $188,661
3
Beds
2
Baths
1,040
Sq Ft
$173/Sq Ft
Est. Value
About This Home
This home is located at 4 Martin Ct, Florissant, MO 63033 and is currently estimated at $179,415, approximately $172 per square foot. 4 Martin Ct is a home located in St. Louis County with nearby schools including Wedgwood Elementary School, Cross Keys Middle School, and McCluer North High School.
Ownership History
Date
Name
Owned For
Owner Type
Purchase Details
Closed on
Sep 22, 2011
Sold by
Ruffino Steven L and Ruffino Rebecca J
Bought by
Ruffino Steven and Ruffino Rebecca
Current Estimated Value
Home Financials for this Owner
Home Financials are based on the most recent Mortgage that was taken out on this home.
Original Mortgage
$117,259
Outstanding Balance
$10,339
Interest Rate
4.24%
Mortgage Type
FHA
Estimated Equity
$169,076
Purchase Details
Closed on
Feb 21, 2007
Sold by
Ruffino Steven L and Ruffino Richard K
Bought by
Ruffino Steven L and Staley Rebecca J
Home Financials for this Owner
Home Financials are based on the most recent Mortgage that was taken out on this home.
Original Mortgage
$105,000
Interest Rate
6.21%
Mortgage Type
Stand Alone Refi Refinance Of Original Loan
Purchase Details
Closed on
May 26, 2004
Sold by
Johnson Steven W and Johnson Sharon M Gagnepain
Bought by
Ruffino Steve L and Ruffino Richard K
Home Financials for this Owner
Home Financials are based on the most recent Mortgage that was taken out on this home.
Original Mortgage
$104,139
Interest Rate
5.97%
Mortgage Type
FHA
Create a Home Valuation Report for This Property
The Home Valuation Report is an in-depth analysis detailing your home's value as well as a comparison with similar homes in the area
Home Values in the Area
Average Home Value in this Area
Purchase History
| Date | Buyer | Sale Price | Title Company |
|---|---|---|---|
| Ruffino Steven | -- | Innovative Title Solutions L | |
| Ruffino Steven L | -- | Pulaski Title Company | |
| Ruffino Steve L | -- | -- |
Source: Public Records
Mortgage History
| Date | Status | Borrower | Loan Amount |
|---|---|---|---|
| Open | Ruffino Steven | $117,259 | |
| Closed | Ruffino Steven L | $105,000 | |
| Closed | Ruffino Steve L | $104,139 |
Source: Public Records
Tax History Compared to Growth
Tax History
| Year | Tax Paid | Tax Assessment Tax Assessment Total Assessment is a certain percentage of the fair market value that is determined by local assessors to be the total taxable value of land and additions on the property. | Land | Improvement |
|---|---|---|---|---|
| 2025 | $2,381 | $34,070 | $5,210 | $28,860 |
| 2024 | $2,381 | $30,780 | $4,520 | $26,260 |
| 2023 | $2,373 | $30,780 | $4,520 | $26,260 |
| 2022 | $2,089 | $23,790 | $4,520 | $19,270 |
| 2021 | $2,054 | $23,790 | $4,520 | $19,270 |
| 2020 | $1,994 | $21,720 | $4,010 | $17,710 |
| 2019 | $1,955 | $21,720 | $4,010 | $17,710 |
| 2018 | $1,713 | $16,970 | $2,190 | $14,780 |
| 2017 | $1,704 | $16,970 | $2,190 | $14,780 |
| 2016 | $1,769 | $17,180 | $2,570 | $14,610 |
| 2015 | $1,780 | $17,180 | $2,570 | $14,610 |
| 2014 | $1,764 | $17,590 | $4,310 | $13,280 |
Source: Public Records
Map
Nearby Homes
- 2375 Hummingbird Dr
- 1545 Bluefield Dr
- 1205 Fox Run Dr
- 1215 Pamela Dr
- 2315 Bramble Ln
- 2133 Morning Mist Ct
- 43 Saint Celeste Dr
- 1665 Saddlespur Ln
- 37 Marquette Dr
- 2465 Brown Ln
- 1480 Burning Tree Dr
- 220 Versailles Dr
- 2433 Lavin Ct
- 2555 Guildford Dr
- 1420 Nashua Dr
- 2701 Wellington Dr
- 2570 Guildford Dr
- 325 Moule Dr
- 2185 Orleans Ln
- 1993 Greenheath Dr
- 3 Martin Ct
- 2170 Cardinal Dr
- 5 Martin Ct
- 2150 Cardinal Dr
- 2210 Cardinal Dr
- 1950 Thunderbird Ave
- 1960 Thunderbird Ave
- 1940 Thunderbird Ave
- 2 Martin Ct
- 2220 Cardinal Dr
- 6 Martin Ct
- 1970 Thunderbird Ave
- 1920 Thunderbird Ave
- 2225 Martin Dr
- 2240 Cardinal Dr
- 2265 Martin Dr
- 1900 Thunderbird Ave
- 2205 Martin Dr
- 2175 Cardinal Dr
- 2155 Cardinal Dr