4 Mary m Cir Sagamore Beach, MA 02562
Estimated Value: $621,000 - $724,000
4
Beds
2
Baths
1,838
Sq Ft
$363/Sq Ft
Est. Value
About This Home
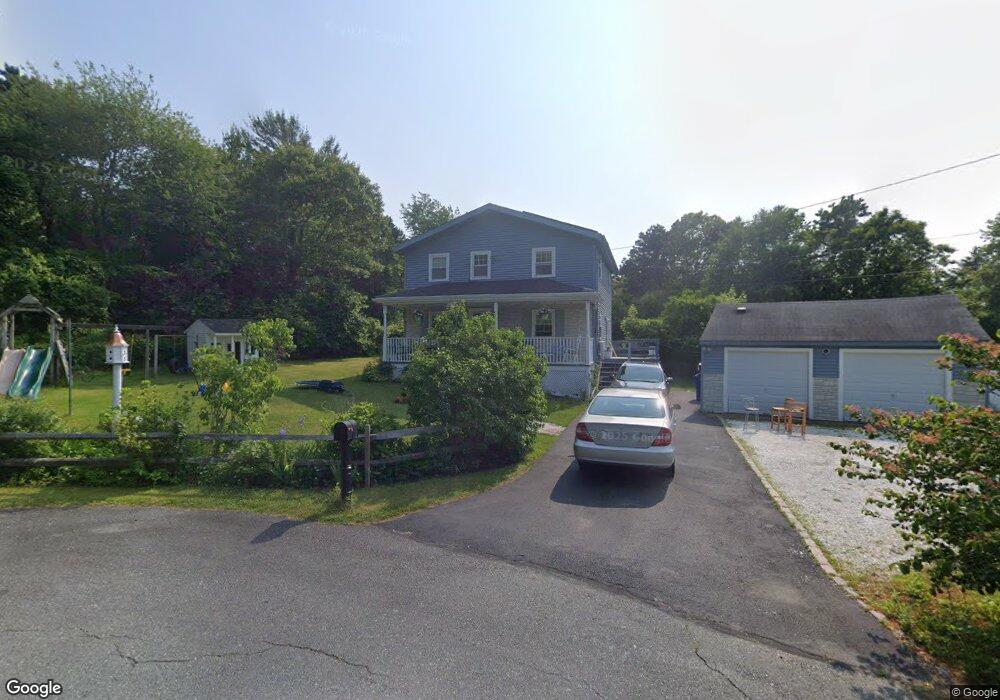
This home is located at 4 Mary m Cir, Sagamore Beach, MA 02562 and is currently estimated at $666,981, approximately $362 per square foot. 4 Mary m Cir is a home located in Barnstable County with nearby schools including Bourne High School, Bridgeview Montessori School, and Waldorf School of Cape Cod.
Ownership History
Date
Name
Owned For
Owner Type
Purchase Details
Closed on
Dec 6, 2019
Sold by
Beguerie Beth J and Beguerie David M
Bought by
Beguerie Ft and Beguerie
Current Estimated Value
Purchase Details
Closed on
Apr 9, 2010
Sold by
Beguerie David and Beguerie Beth
Bought by
Beguerie David and Beguerie Beth
Home Financials for this Owner
Home Financials are based on the most recent Mortgage that was taken out on this home.
Original Mortgage
$226,000
Interest Rate
5.12%
Mortgage Type
Purchase Money Mortgage
Purchase Details
Closed on
Feb 26, 2008
Sold by
Res Funding Co Llc
Bought by
Beguerie Beth and Beguerie David
Purchase Details
Closed on
Feb 6, 2008
Sold by
Mulcahy Gerard E and Residential Fund Co Ll
Bought by
Res Funding Co Llc
Create a Home Valuation Report for This Property
The Home Valuation Report is an in-depth analysis detailing your home's value as well as a comparison with similar homes in the area
Home Values in the Area
Average Home Value in this Area
Purchase History
| Date | Buyer | Sale Price | Title Company |
|---|---|---|---|
| Beguerie Ft | -- | None Available | |
| Beguerie Ft | -- | None Available | |
| Beguerie David | -- | -- | |
| Beguerie David | -- | -- | |
| Beguerie David | -- | -- | |
| Beguerie Beth | $250,200 | -- | |
| Beguerie Beth | $250,200 | -- | |
| Res Funding Co Llc | $270,000 | -- | |
| Res Funding Co Llc | $270,000 | -- |
Source: Public Records
Mortgage History
| Date | Status | Borrower | Loan Amount |
|---|---|---|---|
| Previous Owner | Res Funding Co Llc | $226,000 | |
| Previous Owner | Beguerie David | $226,000 |
Source: Public Records
Tax History Compared to Growth
Tax History
| Year | Tax Paid | Tax Assessment Tax Assessment Total Assessment is a certain percentage of the fair market value that is determined by local assessors to be the total taxable value of land and additions on the property. | Land | Improvement |
|---|---|---|---|---|
| 2025 | $4,419 | $565,800 | $208,300 | $357,500 |
| 2024 | $4,353 | $542,800 | $198,400 | $344,400 |
| 2023 | $4,291 | $487,100 | $175,600 | $311,500 |
| 2022 | $4,113 | $407,600 | $155,400 | $252,200 |
| 2021 | $4,029 | $374,100 | $141,400 | $232,700 |
| 2020 | $3,908 | $363,900 | $140,100 | $223,800 |
| 2019 | $3,714 | $353,400 | $140,100 | $213,300 |
| 2018 | $3,440 | $326,400 | $133,400 | $193,000 |
| 2017 | $3,330 | $323,300 | $132,200 | $191,100 |
| 2016 | $2,868 | $282,300 | $132,200 | $150,100 |
| 2015 | $2,721 | $270,200 | $120,100 | $150,100 |
Source: Public Records
Map
Nearby Homes
- 38 Siasconset Dr
- 42 Siasconset Dr
- 4 Fieldwood Dr
- 4 Fieldwood Dr
- 51 Commonwealth Ave
- 51 Commonwealth Ave
- 16 Ocean Pines Dr Unit B
- 18 Ocean Pines Dr Unit A
- 18 Ocean Pines Dr Unit B
- 33 Buzzards Bay Ave
- 133 Phillips Rd
- 67 Phillips Rd
- 67 Phillips Rd
- 6 Louis Ave
- 10 Tecumseh Rd
- 311 Phillips Rd
- 1 Wildwood Ln Unit D
- 5 Oakwood Dr
- 15 Route 6a
- 0 State Rd