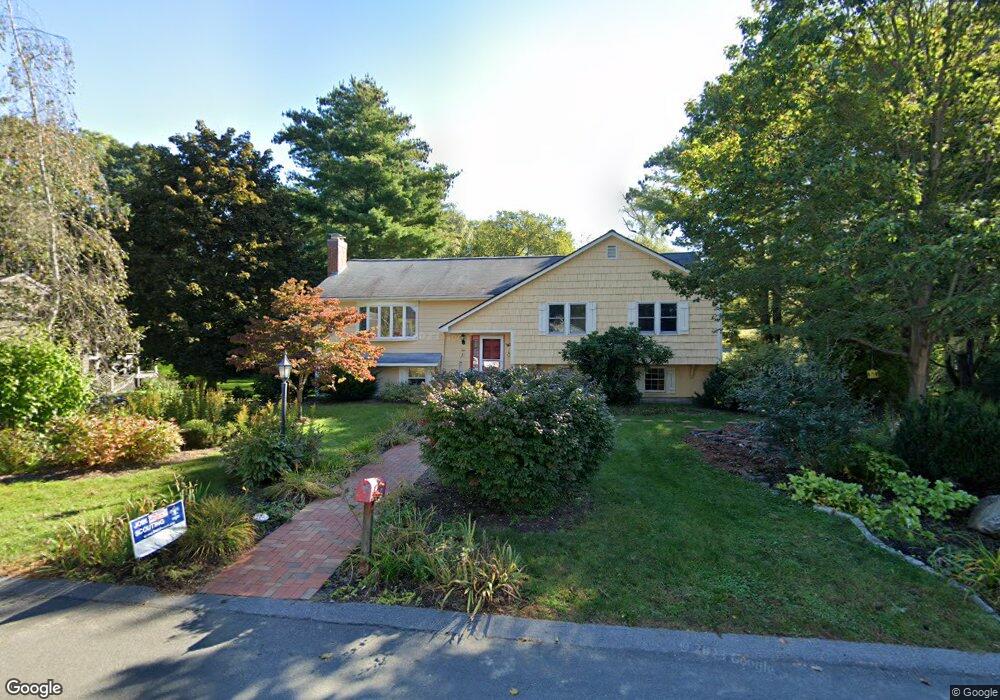
4 Maureen Rd Lexington, MA 02420
Munroe Hill NeighborhoodEstimated Value: $1,627,000 - $1,773,000
4
Beds
3
Baths
2,041
Sq Ft
$839/Sq Ft
Est. Value
About This Home
This home is located at 4 Maureen Rd, Lexington, MA 02420 and is currently estimated at $1,711,827, approximately $838 per square foot. 4 Maureen Rd is a home located in Middlesex County with nearby schools including Fiske Elementary School, William Diamond Middle School, and Lexington High School.
Ownership History
Date
Name
Owned For
Owner Type
Purchase Details
Closed on
Jul 7, 2006
Sold by
Gabour Adam and Moussa-Gabour Gloria
Bought by
Frohman David M and Frohman Maria
Current Estimated Value
Home Financials for this Owner
Home Financials are based on the most recent Mortgage that was taken out on this home.
Original Mortgage
$330,000
Outstanding Balance
$195,372
Interest Rate
6.6%
Mortgage Type
Purchase Money Mortgage
Estimated Equity
$1,516,455
Purchase Details
Closed on
Jun 1, 1994
Sold by
Hakes Jerry W and Hakes Jane A
Bought by
Gabour Adam and Gabour Gloria M
Create a Home Valuation Report for This Property
The Home Valuation Report is an in-depth analysis detailing your home's value as well as a comparison with similar homes in the area
Home Values in the Area
Average Home Value in this Area
Purchase History
| Date | Buyer | Sale Price | Title Company |
|---|---|---|---|
| Frohman David M | $726,500 | -- | |
| Frohman David M | $726,500 | -- | |
| Gabour Adam | $349,900 | -- | |
| Gabour Adam | $349,900 | -- |
Source: Public Records
Mortgage History
| Date | Status | Borrower | Loan Amount |
|---|---|---|---|
| Open | Frohman David M | $330,000 | |
| Closed | Gabour Adam | $330,000 | |
| Previous Owner | Gabour Adam | $311,000 |
Source: Public Records
Tax History Compared to Growth
Tax History
| Year | Tax Paid | Tax Assessment Tax Assessment Total Assessment is a certain percentage of the fair market value that is determined by local assessors to be the total taxable value of land and additions on the property. | Land | Improvement |
|---|---|---|---|---|
| 2025 | $17,318 | $1,416,000 | $1,008,000 | $408,000 |
| 2024 | $16,599 | $1,355,000 | $960,000 | $395,000 |
| 2023 | $15,821 | $1,217,000 | $873,000 | $344,000 |
| 2022 | $15,014 | $1,088,000 | $794,000 | $294,000 |
| 2021 | $14,850 | $1,032,000 | $727,000 | $305,000 |
| 2020 | $14,275 | $1,016,000 | $727,000 | $289,000 |
| 2019 | $13,922 | $986,000 | $721,000 | $265,000 |
| 2018 | $13,042 | $912,000 | $660,000 | $252,000 |
| 2017 | $12,635 | $872,000 | $629,000 | $243,000 |
| 2016 | $12,454 | $853,000 | $598,000 | $255,000 |
| 2015 | $11,606 | $781,000 | $544,000 | $237,000 |
| 2014 | $10,237 | $660,000 | $494,000 | $166,000 |
Source: Public Records
Map
Nearby Homes