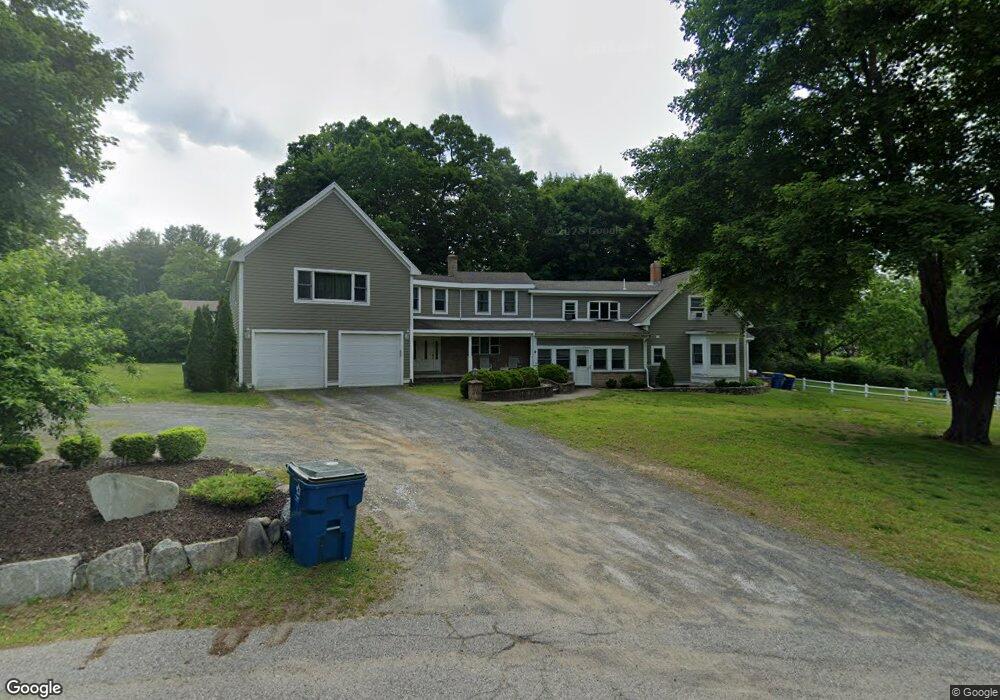
4 Michelle Way East Bridgewater, MA 02333
Estimated Value: $624,386 - $778,000
4
Beds
3
Baths
3,356
Sq Ft
$207/Sq Ft
Est. Value
About This Home
This home is located at 4 Michelle Way, East Bridgewater, MA 02333 and is currently estimated at $695,097, approximately $207 per square foot. 4 Michelle Way is a home located in Plymouth County with nearby schools including Gordon W Mitchell Middle School, East Bridgewater Jr./Sr. High School, and New Heights Charter School.
Ownership History
Date
Name
Owned For
Owner Type
Purchase Details
Closed on
Jul 1, 1997
Sold by
Madden John L
Bought by
Smith Shawn V and Smith Lisa A
Current Estimated Value
Create a Home Valuation Report for This Property
The Home Valuation Report is an in-depth analysis detailing your home's value as well as a comparison with similar homes in the area
Home Values in the Area
Average Home Value in this Area
Purchase History
| Date | Buyer | Sale Price | Title Company |
|---|---|---|---|
| Smith Shawn V | $137,000 | -- |
Source: Public Records
Mortgage History
| Date | Status | Borrower | Loan Amount |
|---|---|---|---|
| Open | Smith Shawn V | $242,000 | |
| Closed | Smith Shawn V | $50,000 | |
| Closed | Smith Shawn V | $185,000 | |
| Closed | Smith Shawn V | $180,000 |
Source: Public Records
Tax History Compared to Growth
Tax History
| Year | Tax Paid | Tax Assessment Tax Assessment Total Assessment is a certain percentage of the fair market value that is determined by local assessors to be the total taxable value of land and additions on the property. | Land | Improvement |
|---|---|---|---|---|
| 2025 | $6,709 | $490,800 | $189,100 | $301,700 |
| 2024 | $6,707 | $484,600 | $181,800 | $302,800 |
| 2023 | $6,703 | $463,900 | $181,800 | $282,100 |
| 2022 | $6,909 | $442,900 | $165,400 | $277,500 |
| 2021 | $6,701 | $393,000 | $158,900 | $234,100 |
| 2020 | $6,651 | $384,700 | $152,800 | $231,900 |
| 2019 | $6,329 | $360,400 | $146,000 | $214,400 |
| 2018 | $6,092 | $339,200 | $146,000 | $193,200 |
| 2017 | $5,979 | $326,700 | $139,300 | $187,400 |
| 2016 | $5,869 | $323,200 | $139,300 | $183,900 |
| 2015 | $5,765 | $324,600 | $138,300 | $186,300 |
| 2014 | $5,647 | $325,100 | $135,400 | $189,700 |
Source: Public Records
Map
Nearby Homes