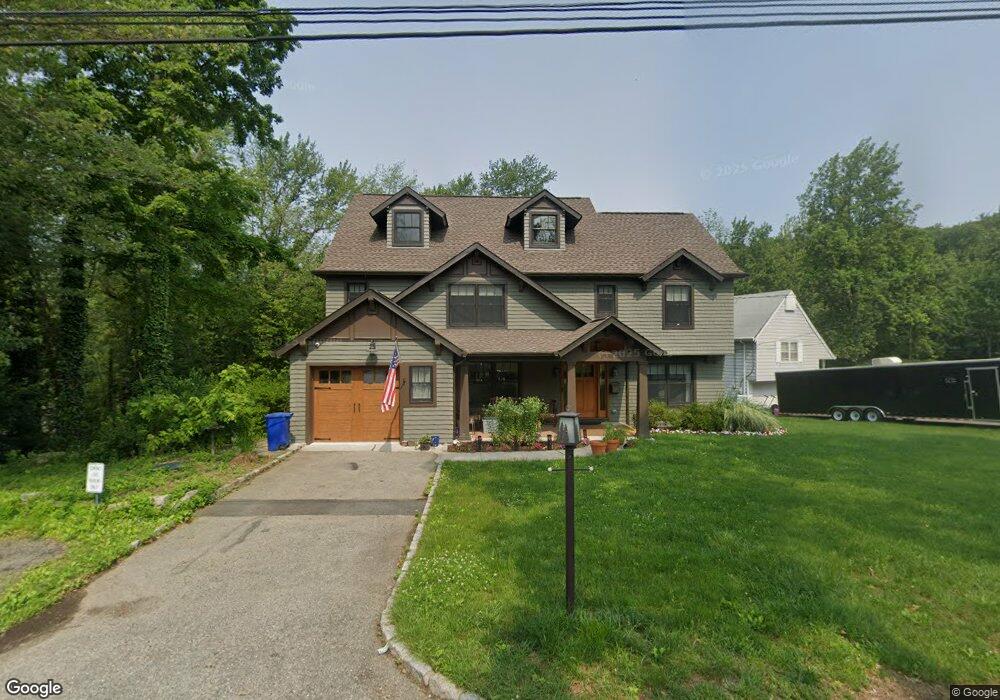
4 Midland Trail Kinnelon, NJ 07405
Estimated Value: $798,898 - $990,000
--
Bed
--
Bath
2,571
Sq Ft
$355/Sq Ft
Est. Value
About This Home
This home is located at 4 Midland Trail, Kinnelon, NJ 07405 and is currently estimated at $912,975, approximately $355 per square foot. 4 Midland Trail is a home located in Morris County with nearby schools including Kiel School, Stonybrook School, and Pearl R. Miller Middle School.
Ownership History
Date
Name
Owned For
Owner Type
Purchase Details
Closed on
Jan 28, 1999
Sold by
Bernet George A and Bernet Robert C
Bought by
Cox Edward D and Cox Rosemary
Current Estimated Value
Home Financials for this Owner
Home Financials are based on the most recent Mortgage that was taken out on this home.
Original Mortgage
$210,000
Outstanding Balance
$49,706
Interest Rate
6.74%
Mortgage Type
Stand Alone First
Estimated Equity
$863,269
Create a Home Valuation Report for This Property
The Home Valuation Report is an in-depth analysis detailing your home's value as well as a comparison with similar homes in the area
Home Values in the Area
Average Home Value in this Area
Purchase History
| Date | Buyer | Sale Price | Title Company |
|---|---|---|---|
| Cox Edward D | $286,000 | -- |
Source: Public Records
Mortgage History
| Date | Status | Borrower | Loan Amount |
|---|---|---|---|
| Open | Cox Edward D | $210,000 |
Source: Public Records
Tax History Compared to Growth
Tax History
| Year | Tax Paid | Tax Assessment Tax Assessment Total Assessment is a certain percentage of the fair market value that is determined by local assessors to be the total taxable value of land and additions on the property. | Land | Improvement |
|---|---|---|---|---|
| 2025 | $17,747 | $612,600 | $249,600 | $363,000 |
| 2024 | $17,379 | $612,600 | $249,600 | $363,000 |
| 2023 | $17,379 | $612,600 | $249,600 | $363,000 |
| 2022 | $16,522 | $612,600 | $249,600 | $363,000 |
| 2021 | $16,522 | $612,600 | $249,600 | $363,000 |
| 2020 | $12,163 | $459,500 | $249,600 | $209,900 |
| 2019 | $11,883 | $459,500 | $249,600 | $209,900 |
| 2018 | $11,639 | $459,500 | $249,600 | $209,900 |
| 2017 | $11,442 | $459,500 | $249,600 | $209,900 |
| 2016 | $9,786 | $301,000 | $153,600 | $147,400 |
| 2015 | $9,397 | $301,000 | $153,600 | $147,400 |
| 2014 | $9,238 | $301,000 | $153,600 | $147,400 |
Source: Public Records
Map
Nearby Homes
- 4 Ledgewood Trail
- 2 Denise Dr
- 15 Saw Mill Rd
- 5 Old Gormley Ln
- 5 Old Gormely Ln
- 8 Denise Dr
- 24 Denise Dr
- 60 Brown Ave
- 233 Boonton Ave
- 303 Brook Valley Rd
- 47 Cutlass Rd
- 45 Alize Dr
- 14 Chilhowie Dr
- 176 Boonton Ave
- 00 Reality Dr
- 77 Reservoir Ave
- 141 Boonton Ave
- 1 Brook Valley Terrace
- 9 Vista Ct
- 16 Valley Rd