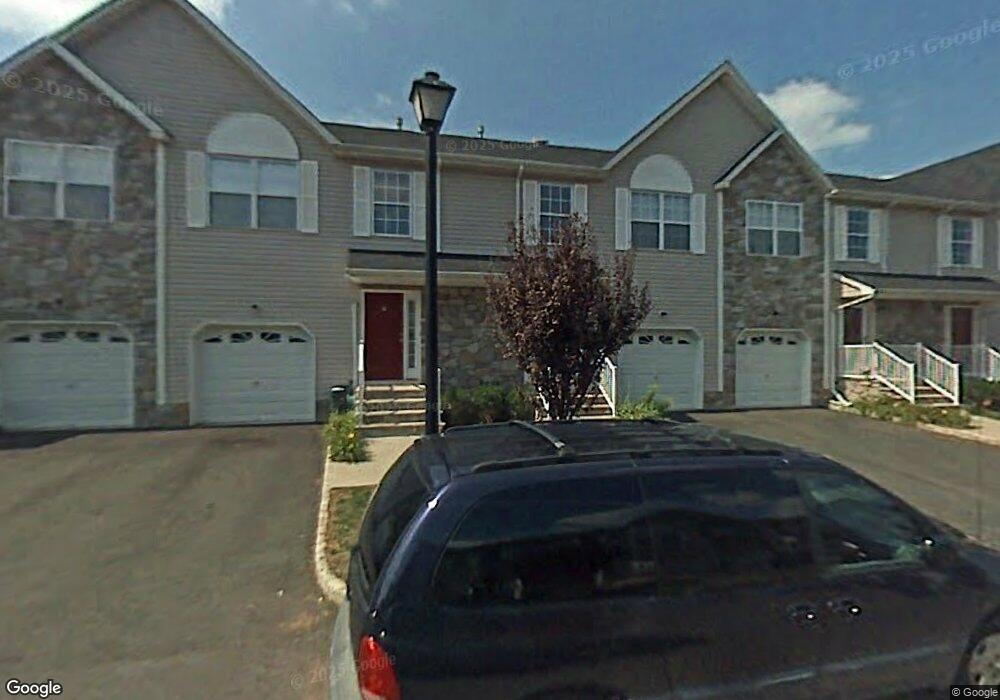
4 Mindy Dr Somerset, NJ 08873
Estimated Value: $497,000 - $550,000
3
Beds
3
Baths
1,488
Sq Ft
$354/Sq Ft
Est. Value
About This Home
This home is located at 4 Mindy Dr, Somerset, NJ 08873 and is currently estimated at $527,378, approximately $354 per square foot. 4 Mindy Dr is a home located in Somerset County with nearby schools including Franklin High School, Cheder Menachem, and St. Augustine of Canterbury School.
Ownership History
Date
Name
Owned For
Owner Type
Purchase Details
Closed on
Mar 24, 2006
Sold by
Fang Peter J W
Bought by
Elahi Shaikh M and Elahi Talat P
Current Estimated Value
Home Financials for this Owner
Home Financials are based on the most recent Mortgage that was taken out on this home.
Original Mortgage
$355,000
Outstanding Balance
$198,611
Interest Rate
6%
Mortgage Type
Adjustable Rate Mortgage/ARM
Estimated Equity
$328,767
Create a Home Valuation Report for This Property
The Home Valuation Report is an in-depth analysis detailing your home's value as well as a comparison with similar homes in the area
Home Values in the Area
Average Home Value in this Area
Purchase History
| Date | Buyer | Sale Price | Title Company |
|---|---|---|---|
| Elahi Shaikh M | $355,000 | -- | |
| Elahi Shaikh M | $355,000 | None Available |
Source: Public Records
Mortgage History
| Date | Status | Borrower | Loan Amount |
|---|---|---|---|
| Open | Elahi Shaikh M | $355,000 | |
| Closed | Elahi Shaikh M | $355,000 |
Source: Public Records
Tax History Compared to Growth
Tax History
| Year | Tax Paid | Tax Assessment Tax Assessment Total Assessment is a certain percentage of the fair market value that is determined by local assessors to be the total taxable value of land and additions on the property. | Land | Improvement |
|---|---|---|---|---|
| 2025 | $7,383 | $488,000 | $190,000 | $308,700 |
| 2024 | $7,383 | $409,500 | $190,000 | $230,200 |
| 2023 | $7,294 | $379,500 | $160,000 | $219,500 |
| 2022 | $6,682 | $329,500 | $110,000 | $219,500 |
| 2021 | $6,500 | $294,500 | $75,000 | $219,500 |
| 2020 | $6,314 | $279,500 | $60,000 | $219,500 |
| 2019 | $6,163 | $269,500 | $50,000 | $219,500 |
| 2018 | $6,124 | $265,100 | $50,000 | $215,100 |
| 2017 | $6,148 | $265,100 | $50,000 | $215,100 |
| 2016 | $6,201 | $265,100 | $50,000 | $215,100 |
| 2015 | $5,972 | $257,100 | $42,000 | $215,100 |
| 2014 | $5,860 | $256,100 | $41,000 | $215,100 |
Source: Public Records
Map
Nearby Homes