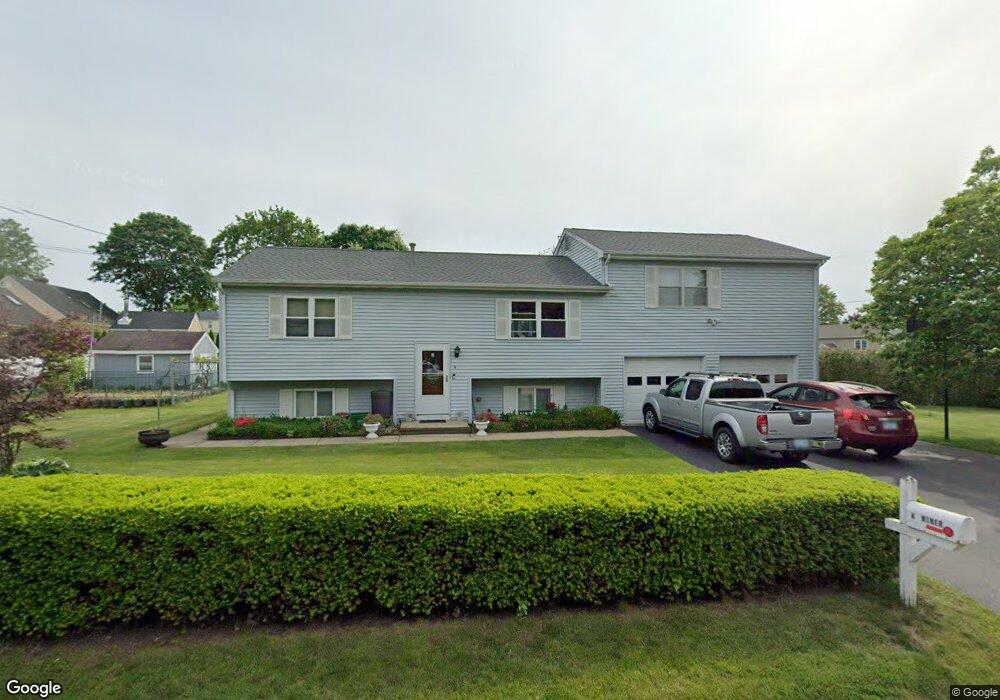
4 Miner St Westerly, RI 02891
Estimated Value: $462,000 - $568,000
3
Beds
3
Baths
1,440
Sq Ft
$354/Sq Ft
Est. Value
About This Home
This home is located at 4 Miner St, Westerly, RI 02891 and is currently estimated at $509,845, approximately $354 per square foot. 4 Miner St is a home located in Washington County with nearby schools including Westerly High School, North Stonington Christian Academy, and St. Michael School.
Ownership History
Date
Name
Owned For
Owner Type
Purchase Details
Closed on
Oct 30, 2014
Sold by
Jarvis Victoria L and Jarvis Robert
Bought by
Gencarelli Giorgina and Gencarelli Paola
Current Estimated Value
Home Financials for this Owner
Home Financials are based on the most recent Mortgage that was taken out on this home.
Original Mortgage
$184,500
Outstanding Balance
$141,611
Interest Rate
4.21%
Mortgage Type
New Conventional
Estimated Equity
$368,234
Purchase Details
Closed on
Jan 31, 1986
Bought by
Gencarelli Giovanni and Gencarelli Giorgina
Create a Home Valuation Report for This Property
The Home Valuation Report is an in-depth analysis detailing your home's value as well as a comparison with similar homes in the area
Home Values in the Area
Average Home Value in this Area
Purchase History
| Date | Buyer | Sale Price | Title Company |
|---|---|---|---|
| Gencarelli Giorgina | $205,000 | -- | |
| Gencarelli Giovanni | -- | -- |
Source: Public Records
Mortgage History
| Date | Status | Borrower | Loan Amount |
|---|---|---|---|
| Open | Gencarelli Giorgina | $184,500 | |
| Previous Owner | Gencarelli Giovanni | $16,000 | |
| Previous Owner | Gencarelli Giovanni | $30,000 |
Source: Public Records
Tax History
| Year | Tax Paid | Tax Assessment Tax Assessment Total Assessment is a certain percentage of the fair market value that is determined by local assessors to be the total taxable value of land and additions on the property. | Land | Improvement |
|---|---|---|---|---|
| 2025 | $3,184 | $409,300 | $151,200 | $258,100 |
| 2024 | $3,418 | $327,100 | $108,000 | $219,100 |
| 2023 | $3,323 | $327,100 | $108,000 | $219,100 |
| 2022 | $3,304 | $327,100 | $108,000 | $219,100 |
| 2021 | $3,218 | $266,800 | $93,900 | $172,900 |
| 2020 | $3,162 | $266,800 | $93,900 | $172,900 |
| 2019 | $3,132 | $266,800 | $93,900 | $172,900 |
| 2018 | $2,990 | $242,100 | $93,900 | $148,200 |
| 2017 | $2,905 | $242,100 | $93,900 | $148,200 |
| 2016 | $2,905 | $242,100 | $93,900 | $148,200 |
| 2015 | $2,783 | $247,800 | $95,900 | $151,900 |
| 2014 | $2,738 | $247,800 | $95,900 | $151,900 |
Source: Public Records
Map
Nearby Homes
Your Personal Tour Guide
Ask me questions while you tour the home.