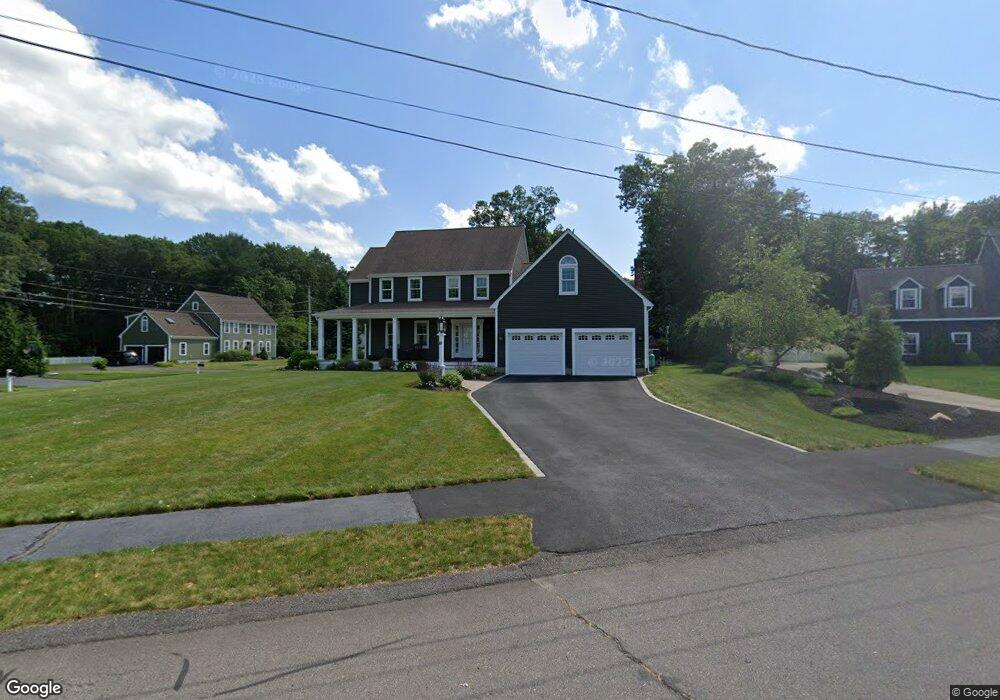
4 Mockingbird Ln Walpole, MA 02081
Estimated Value: $940,000 - $1,123,000
4
Beds
3
Baths
2,667
Sq Ft
$385/Sq Ft
Est. Value
About This Home
This home is located at 4 Mockingbird Ln, Walpole, MA 02081 and is currently estimated at $1,025,683, approximately $384 per square foot. 4 Mockingbird Ln is a home located in Norfolk County with nearby schools including Elm Street School, Eleanor N. Johnson Middle School, and Walpole High School.
Ownership History
Date
Name
Owned For
Owner Type
Purchase Details
Closed on
Jul 8, 2021
Sold by
Manty R Stephen R and Manty Susan M
Bought by
Manty Ret
Current Estimated Value
Purchase Details
Closed on
Mar 27, 2015
Sold by
Grady Ft
Bought by
Manty R S and Manty Susan M
Home Financials for this Owner
Home Financials are based on the most recent Mortgage that was taken out on this home.
Original Mortgage
$472,000
Interest Rate
3.68%
Mortgage Type
New Conventional
Purchase Details
Closed on
Oct 24, 2012
Sold by
Grady John R and Grady Deborah A
Bought by
Grady Ft and Grady John R
Purchase Details
Closed on
Apr 30, 1991
Sold by
Windham Corp
Bought by
Grady John R
Create a Home Valuation Report for This Property
The Home Valuation Report is an in-depth analysis detailing your home's value as well as a comparison with similar homes in the area
Home Values in the Area
Average Home Value in this Area
Purchase History
| Date | Buyer | Sale Price | Title Company |
|---|---|---|---|
| Manty Ret | -- | None Available | |
| Manty R S | $590,000 | -- | |
| Grady Ft | -- | -- | |
| Grady John R | $255,000 | -- |
Source: Public Records
Mortgage History
| Date | Status | Borrower | Loan Amount |
|---|---|---|---|
| Previous Owner | Manty R S | $472,000 | |
| Previous Owner | Grady John R | $273,000 | |
| Previous Owner | Grady John R | $275,000 | |
| Previous Owner | Grady John R | $300,000 |
Source: Public Records
Tax History Compared to Growth
Tax History
| Year | Tax Paid | Tax Assessment Tax Assessment Total Assessment is a certain percentage of the fair market value that is determined by local assessors to be the total taxable value of land and additions on the property. | Land | Improvement |
|---|---|---|---|---|
| 2025 | $11,706 | $912,400 | $369,500 | $542,900 |
| 2024 | $11,310 | $855,500 | $355,200 | $500,300 |
| 2023 | $10,734 | $772,800 | $308,900 | $463,900 |
| 2022 | $10,042 | $694,500 | $286,100 | $408,400 |
| 2021 | $9,876 | $665,500 | $269,900 | $395,600 |
| 2020 | $9,438 | $629,600 | $254,600 | $375,000 |
| 2019 | $9,114 | $603,600 | $244,800 | $358,800 |
| 2018 | $8,989 | $588,700 | $236,200 | $352,500 |
| 2017 | $8,740 | $570,100 | $227,200 | $342,900 |
| 2016 | $8,314 | $534,300 | $210,000 | $324,300 |
| 2015 | $7,998 | $509,400 | $200,100 | $309,300 |
| 2014 | $8,167 | $518,200 | $200,100 | $318,100 |
Source: Public Records
Map
Nearby Homes
- 1391 Main St Unit 304
- 1391 Main St Unit 208
- 1391 Main St Unit 305
- 1391 Main St Unit 308
- 66 Oak St
- 8 Autumn Ln
- 145 South St Unit 5
- 145 South St Unit 19
- 18 Teal Cir
- 127 Clear Pond Dr
- 137 Clear Pond Dr
- 24 Pelican Dr
- 16 Magpie Cir Unit 16
- 1648 Main St
- 10 Sandtrap Cir Unit 2
- 31 Sandtrap Cir Unit 5
- 13 Sandtrap Cir Unit 14
- 11 Sandtrap Cir Unit 15
- 20 Sandtrap Cir Unit 4
- 18 Sandtrap Cir Unit 3