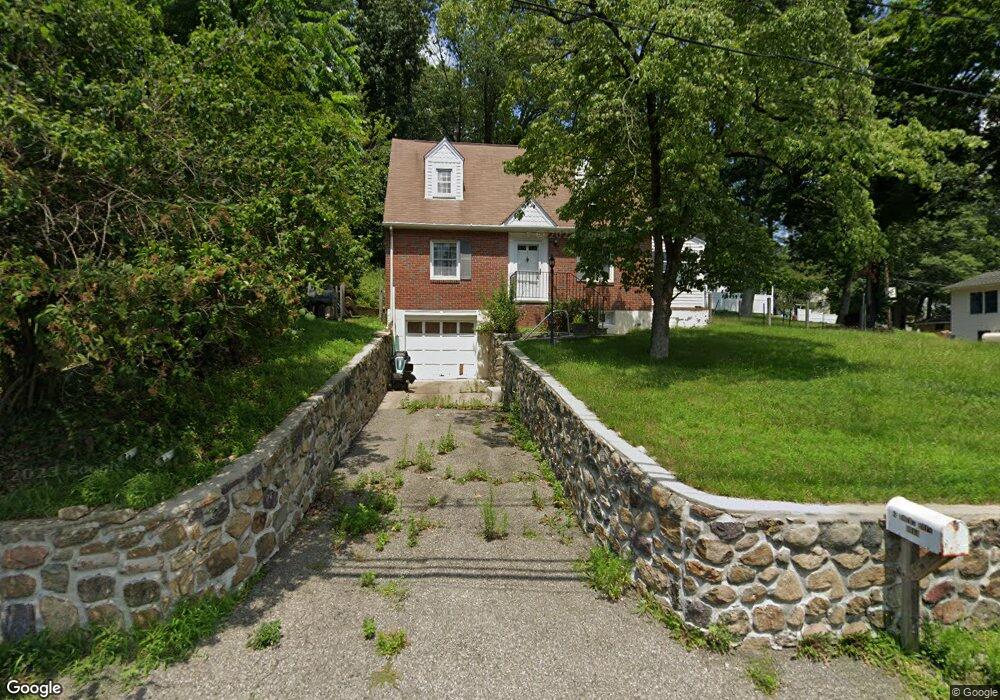
4 Mount Hope Rd Rockaway, NJ 07866
Estimated Value: $392,000 - $675,000
--
Bed
--
Bath
1,810
Sq Ft
$298/Sq Ft
Est. Value
About This Home
This home is located at 4 Mount Hope Rd, Rockaway, NJ 07866 and is currently estimated at $538,998, approximately $297 per square foot. 4 Mount Hope Rd is a home located in Morris County with nearby schools including Stony Brook School, Copeland Middle School, and Divine Mercy Academy.
Ownership History
Date
Name
Owned For
Owner Type
Purchase Details
Closed on
Aug 20, 2020
Sold by
Barber Michelle E and Estate Of Ciro F Neglia
Bought by
Haigh Brianna Lynne and Bradley Eric Francis
Current Estimated Value
Home Financials for this Owner
Home Financials are based on the most recent Mortgage that was taken out on this home.
Original Mortgage
$268,055
Outstanding Balance
$237,340
Interest Rate
2.9%
Mortgage Type
FHA
Estimated Equity
$301,658
Create a Home Valuation Report for This Property
The Home Valuation Report is an in-depth analysis detailing your home's value as well as a comparison with similar homes in the area
Home Values in the Area
Average Home Value in this Area
Purchase History
| Date | Buyer | Sale Price | Title Company |
|---|---|---|---|
| Haigh Brianna Lynne | $273,000 | None Available |
Source: Public Records
Mortgage History
| Date | Status | Borrower | Loan Amount |
|---|---|---|---|
| Open | Haigh Brianna Lynne | $268,055 |
Source: Public Records
Tax History Compared to Growth
Tax History
| Year | Tax Paid | Tax Assessment Tax Assessment Total Assessment is a certain percentage of the fair market value that is determined by local assessors to be the total taxable value of land and additions on the property. | Land | Improvement |
|---|---|---|---|---|
| 2025 | $9,651 | $409,900 | $160,800 | $249,100 |
| 2024 | $9,297 | $376,400 | $145,700 | $230,700 |
| 2023 | $9,297 | $354,300 | $136,000 | $218,300 |
| 2022 | $8,968 | $329,400 | $123,800 | $205,600 |
| 2021 | $8,968 | $316,000 | $119,300 | $196,700 |
| 2020 | $8,787 | $309,300 | $117,000 | $192,300 |
| 2019 | $8,599 | $301,400 | $112,500 | $188,900 |
| 2018 | $8,564 | $295,400 | $114,200 | $181,200 |
| 2017 | $8,717 | $279,200 | $103,800 | $175,400 |
| 2016 | $8,605 | $279,200 | $103,800 | $175,400 |
| 2015 | $8,544 | $279,200 | $103,800 | $175,400 |
| 2014 | $8,384 | $279,200 | $103,800 | $175,400 |
Source: Public Records
Map
Nearby Homes