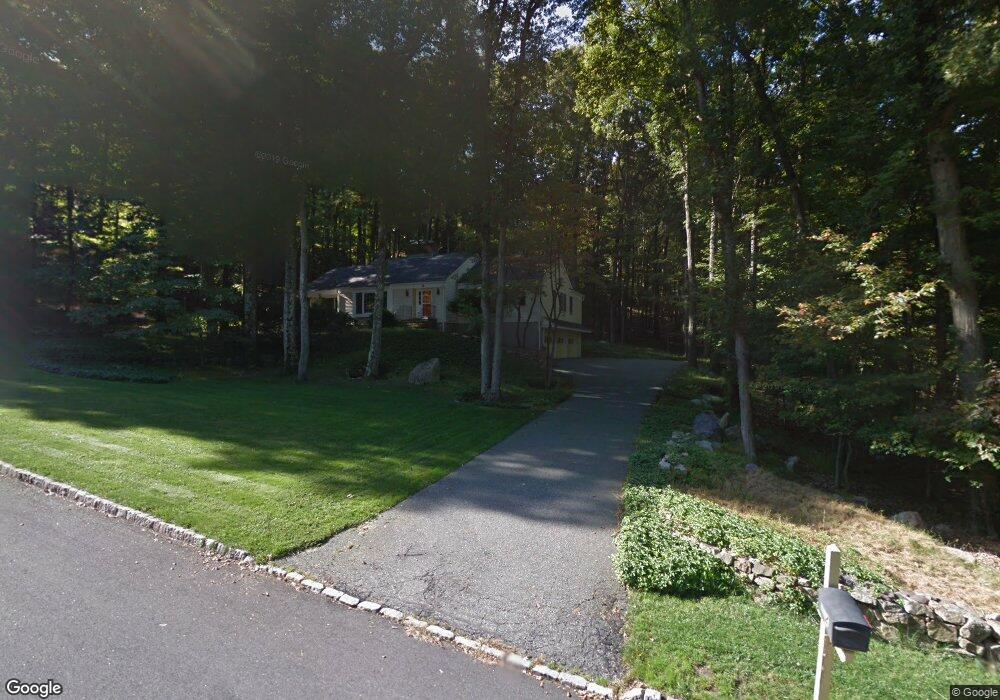
4 Mountain Run Boonton, NJ 07005
Estimated Value: $784,010 - $1,021,000
--
Bed
--
Bath
2,166
Sq Ft
$419/Sq Ft
Est. Value
About This Home
This home is located at 4 Mountain Run, Boonton, NJ 07005 and is currently estimated at $908,503, approximately $419 per square foot. 4 Mountain Run is a home located in Morris County with nearby schools including Rockaway Valley Elementary School and Our Lady of Mount Carmel School.
Ownership History
Date
Name
Owned For
Owner Type
Purchase Details
Closed on
Sep 7, 2010
Sold by
Hover John G and Hover Leila M
Bought by
Choi John and Choi Jung Yoon
Current Estimated Value
Home Financials for this Owner
Home Financials are based on the most recent Mortgage that was taken out on this home.
Original Mortgage
$546,250
Outstanding Balance
$357,211
Interest Rate
4.25%
Mortgage Type
FHA
Estimated Equity
$551,292
Create a Home Valuation Report for This Property
The Home Valuation Report is an in-depth analysis detailing your home's value as well as a comparison with similar homes in the area
Home Values in the Area
Average Home Value in this Area
Purchase History
| Date | Buyer | Sale Price | Title Company |
|---|---|---|---|
| Choi John | $575,000 | New Jersey Title Ins Co |
Source: Public Records
Mortgage History
| Date | Status | Borrower | Loan Amount |
|---|---|---|---|
| Open | Choi John | $546,250 |
Source: Public Records
Tax History Compared to Growth
Tax History
| Year | Tax Paid | Tax Assessment Tax Assessment Total Assessment is a certain percentage of the fair market value that is determined by local assessors to be the total taxable value of land and additions on the property. | Land | Improvement |
|---|---|---|---|---|
| 2025 | $12,878 | $513,900 | $279,800 | $234,100 |
| 2024 | $12,729 | $513,900 | $279,800 | $234,100 |
| 2023 | $12,729 | $513,900 | $279,800 | $234,100 |
| 2022 | $12,205 | $513,900 | $279,800 | $234,100 |
| 2021 | $11,897 | $513,900 | $279,800 | $234,100 |
| 2020 | $12,061 | $513,900 | $279,800 | $234,100 |
| 2019 | $11,897 | $513,900 | $279,800 | $234,100 |
| 2018 | $11,308 | $501,700 | $279,800 | $221,900 |
| 2017 | $11,143 | $501,700 | $279,800 | $221,900 |
| 2016 | $10,815 | $493,400 | $279,800 | $213,600 |
| 2015 | $10,815 | $493,400 | $279,800 | $213,600 |
| 2014 | $10,766 | $493,400 | $279,800 | $213,600 |
Source: Public Records
Map
Nearby Homes