4 Mulcahy Rd Holland, MA 01521
Estimated Value: $222,000 - $307,000
2
Beds
2
Baths
936
Sq Ft
$302/Sq Ft
Est. Value
About This Home
This home is located at 4 Mulcahy Rd, Holland, MA 01521 and is currently estimated at $282,934, approximately $302 per square foot. 4 Mulcahy Rd is a home located in Hampden County with nearby schools including Holland Elementary School, Tantasqua Regional Junior High School, and Tantasqua Regional High School.
Ownership History
Date
Name
Owned For
Owner Type
Purchase Details
Closed on
Nov 19, 2018
Sold by
Trombley Clifford E and Trombley Wendy L
Bought by
Trombley Timothy
Current Estimated Value
Home Financials for this Owner
Home Financials are based on the most recent Mortgage that was taken out on this home.
Original Mortgage
$100,320
Outstanding Balance
$87,679
Interest Rate
4.7%
Mortgage Type
New Conventional
Estimated Equity
$195,255
Purchase Details
Closed on
Apr 28, 1995
Sold by
Fratianni Margaret M
Bought by
Trombley Clifford E and Trombley Wendy L
Home Financials for this Owner
Home Financials are based on the most recent Mortgage that was taken out on this home.
Original Mortgage
$74,949
Interest Rate
8.33%
Mortgage Type
Purchase Money Mortgage
Create a Home Valuation Report for This Property
The Home Valuation Report is an in-depth analysis detailing your home's value as well as a comparison with similar homes in the area
Home Values in the Area
Average Home Value in this Area
Purchase History
| Date | Buyer | Sale Price | Title Company |
|---|---|---|---|
| Trombley Timothy | $100,320 | -- | |
| Trombley Timothy | $100,320 | -- | |
| Trombley Clifford E | $75,000 | -- | |
| Trombley Clifford E | $75,000 | -- |
Source: Public Records
Mortgage History
| Date | Status | Borrower | Loan Amount |
|---|---|---|---|
| Open | Trombley Timothy | $100,320 | |
| Closed | Trombley Timothy | $100,320 | |
| Previous Owner | Trombley Clifford E | $90,000 | |
| Previous Owner | Trombley Clifford E | $71,500 | |
| Previous Owner | Trombley Clifford E | $74,949 |
Source: Public Records
Tax History Compared to Growth
Tax History
| Year | Tax Paid | Tax Assessment Tax Assessment Total Assessment is a certain percentage of the fair market value that is determined by local assessors to be the total taxable value of land and additions on the property. | Land | Improvement |
|---|---|---|---|---|
| 2025 | $2,859 | $220,300 | $45,900 | $174,400 |
| 2024 | $2,775 | $204,800 | $45,900 | $158,900 |
| 2023 | $2,638 | $201,500 | $45,900 | $155,600 |
| 2022 | $2,376 | $152,900 | $40,900 | $112,000 |
| 2021 | $2,294 | $138,000 | $35,400 | $102,600 |
| 2020 | $2,277 | $137,000 | $35,400 | $101,600 |
| 2019 | $2,158 | $129,200 | $35,400 | $93,800 |
| 2018 | $2,128 | $125,200 | $31,400 | $93,800 |
| 2017 | $2,081 | $123,000 | $31,400 | $91,600 |
| 2016 | $2,028 | $126,100 | $33,400 | $92,700 |
| 2015 | -- | $121,800 | $33,400 | $88,400 |
Source: Public Records
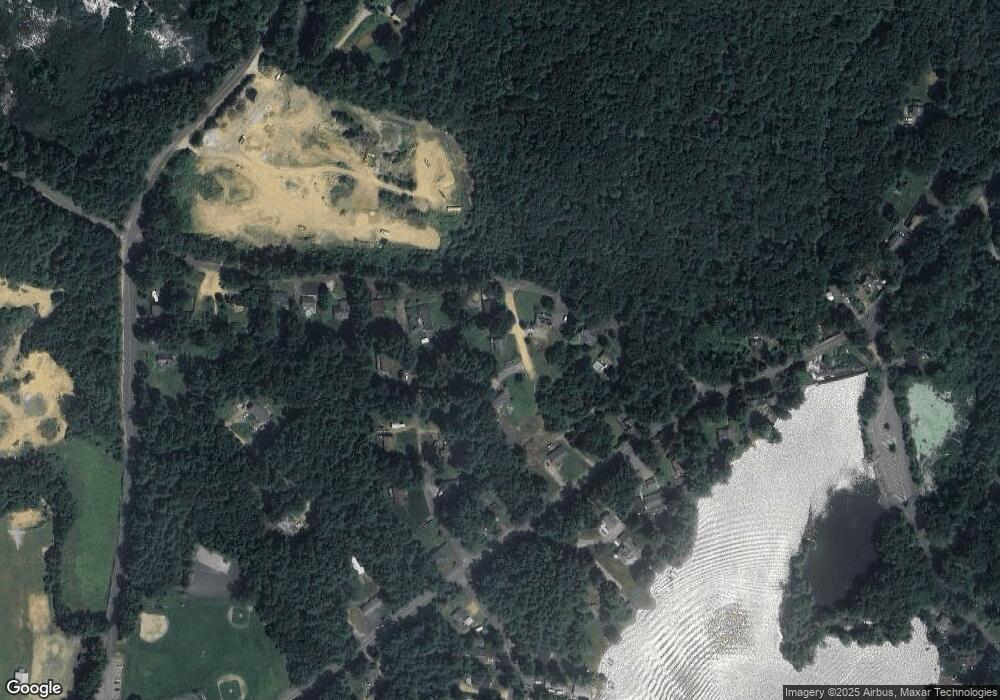
Map
Nearby Homes
- 1 Leno Rd
- 0 E Brimfield Rd
- 6 Kimball Hill Rd
- 2 Farrar Dr
- 4 Lakeshore Ln
- 73 Stafford Rd
- 7 Hisgen Rd
- 3 Sunset Ln
- 9 Chandler Rd
- 87 Vinton Rd
- 266 Holland Rd
- 17 Vinton Rd
- 15 Cherokee Rd
- 3 Forest Dr
- 145 Main St
- 88 Stafford Holland Rd
- 42 Breakneck Rd
- Lot 2 New Holland Rd
- Lot 3 New Holland Rd
- Lot 5 New Holland Rd
- 2 Mulcahy Rd
- 16 Blodgett Dr
- 12 Blodgett Dr
- 9 Dug Hill Rd
- 8 Mulcahy Rd
- Lot 22 Mulcahy Dr
- 10 Blodgett Dr
- 7 Dug Hill Rd
- 8 Blodgett Dr
- 13 Blodgett Dr
- 19 Blodgett Dr
- 5 Dug Hill Rd
- 9 Blodgett Dr
- 65 Sturbridge Rd
- 6 Blodgett Dr
- 21 Dug Hill Rd
- 21 Dug Hill Rd Unit 1
- 69 Sturbridge Rd
- 61 Sturbridge Rd
- 23 Dug Hill Rd