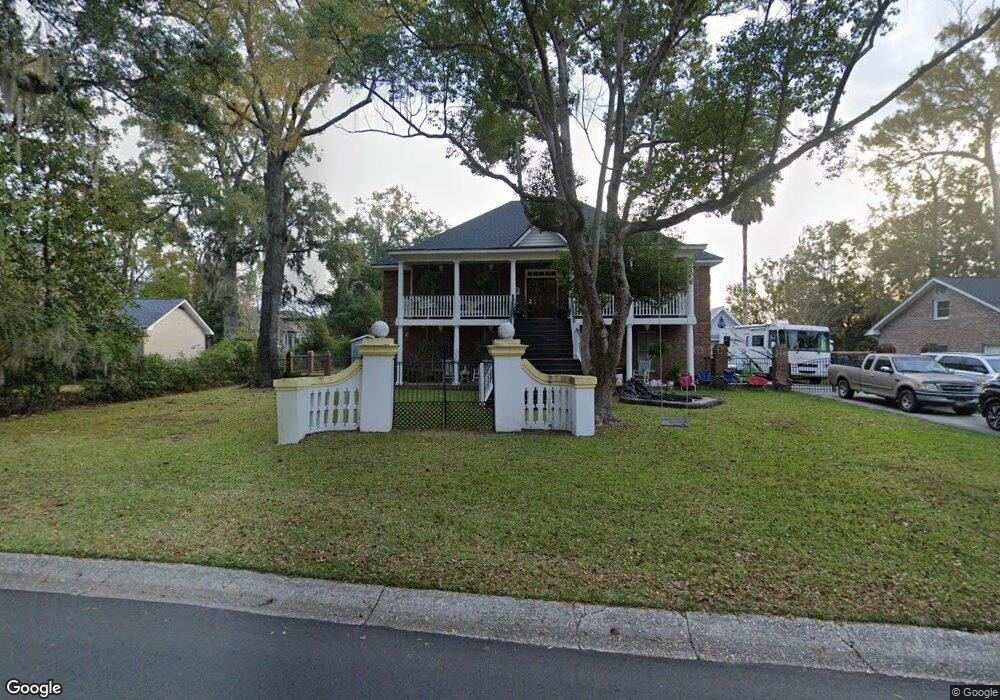
4 N Basilica Ave Hanahan, SC 29410
Estimated Value: $534,000 - $625,395
--
Bed
--
Bath
2,120
Sq Ft
$275/Sq Ft
Est. Value
About This Home
This home is located at 4 N Basilica Ave, Hanahan, SC 29410 and is currently estimated at $583,849, approximately $275 per square foot. 4 N Basilica Ave is a home located in Berkeley County with nearby schools including Hanahan Elementary School, Hanahan Middle School, and Hanahan High School.
Ownership History
Date
Name
Owned For
Owner Type
Purchase Details
Closed on
Jan 7, 2011
Sold by
Evans Lawrence E
Bought by
Cheatle David S and Cheatle Paula C
Current Estimated Value
Home Financials for this Owner
Home Financials are based on the most recent Mortgage that was taken out on this home.
Original Mortgage
$240,000
Outstanding Balance
$6,941
Interest Rate
3.78%
Mortgage Type
Future Advance Clause Open End Mortgage
Estimated Equity
$576,908
Purchase Details
Closed on
Feb 24, 2006
Sold by
Evans Lawrence E
Bought by
Evans Ii Lawrence E
Purchase Details
Closed on
May 22, 2003
Sold by
Witherspoon R Mitchell and Witherspoon Mary Linda S
Bought by
Evans Ii Lawrence E
Purchase Details
Closed on
Feb 13, 2001
Sold by
Buchanan Jerry Brooks
Bought by
Witherspoon R Mitchell and Witherspoon Mary Linda S
Create a Home Valuation Report for This Property
The Home Valuation Report is an in-depth analysis detailing your home's value as well as a comparison with similar homes in the area
Home Values in the Area
Average Home Value in this Area
Purchase History
| Date | Buyer | Sale Price | Title Company |
|---|---|---|---|
| Cheatle David S | $300,000 | -- | |
| Evans Ii Lawrence E | -- | None Available | |
| Evans Ii Lawrence E | $57,000 | -- | |
| Witherspoon R Mitchell | $45,000 | -- |
Source: Public Records
Mortgage History
| Date | Status | Borrower | Loan Amount |
|---|---|---|---|
| Open | Cheatle David S | $240,000 |
Source: Public Records
Tax History Compared to Growth
Tax History
| Year | Tax Paid | Tax Assessment Tax Assessment Total Assessment is a certain percentage of the fair market value that is determined by local assessors to be the total taxable value of land and additions on the property. | Land | Improvement |
|---|---|---|---|---|
| 2025 | $1,922 | $347,024 | $56,203 | $290,821 |
| 2024 | $1,922 | $13,881 | $2,248 | $11,633 |
| 2023 | $1,922 | $13,881 | $2,246 | $11,635 |
| 2022 | $1,873 | $12,071 | $1,871 | $10,200 |
| 2021 | $1,762 | $12,070 | $1,871 | $10,200 |
| 2020 | $1,657 | $12,071 | $1,871 | $10,200 |
| 2019 | $1,720 | $12,071 | $1,871 | $10,200 |
| 2018 | $1,583 | $10,496 | $2,000 | $8,496 |
| 2017 | $1,549 | $10,496 | $2,000 | $8,496 |
| 2016 | $1,577 | $10,500 | $2,000 | $8,500 |
| 2015 | $1,381 | $10,500 | $2,000 | $8,500 |
| 2014 | $1,363 | $10,500 | $2,000 | $8,500 |
| 2013 | -- | $10,500 | $2,000 | $8,500 |
Source: Public Records
Map
Nearby Homes
- 14 Manor Blvd
- 221 Otranto Club Regime Cir
- 8730 N Park Blvd
- 5 Francesca Ave
- 2172 Palermo Place
- 2150 Spoleto Ln Unit H2
- 2150 Spoleto Ln Unit H7
- 2150 Spoleto Ln Unit B-6
- 103 Monte Sano Dr
- 8759 Jessica Ct
- 8885 Old University Blvd
- 8537 Chloe Ln
- 8553 Chloe Ln
- 8216 S Antler Dr
- 1112 Eagle Landing Blvd
- 1044 Steelechase Ln
- 2023 Bearclaw Dr
- 1210 Raven Rd
- 1704 Falcon Cove Ln
- 2425 Vistavia Rd