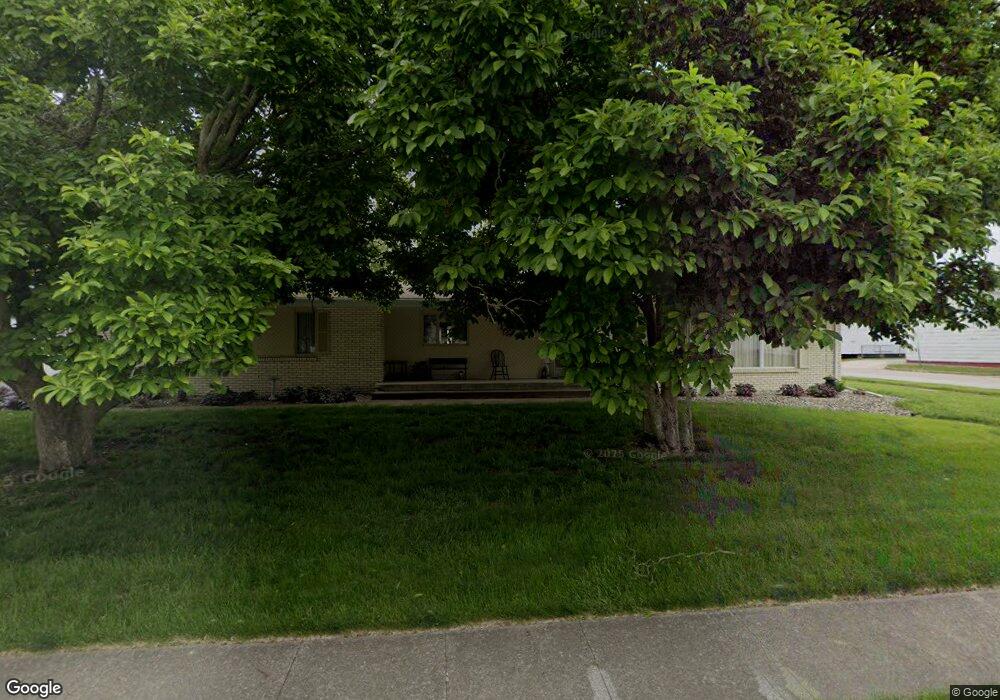
4 N Logan St Oakland, IL 61943
Estimated Value: $155,647 - $242,000
3
Beds
2
Baths
1,933
Sq Ft
$104/Sq Ft
Est. Value
About This Home
This home is located at 4 N Logan St, Oakland, IL 61943 and is currently estimated at $200,912, approximately $103 per square foot. 4 N Logan St is a home with nearby schools including Lake Crest Elementary School and Oakland High School.
Create a Home Valuation Report for This Property
The Home Valuation Report is an in-depth analysis detailing your home's value as well as a comparison with similar homes in the area
Home Values in the Area
Average Home Value in this Area
Tax History Compared to Growth
Tax History
| Year | Tax Paid | Tax Assessment Tax Assessment Total Assessment is a certain percentage of the fair market value that is determined by local assessors to be the total taxable value of land and additions on the property. | Land | Improvement |
|---|---|---|---|---|
| 2024 | -- | $53,691 | $2,041 | $51,650 |
| 2023 | -- | $53,691 | $2,041 | $51,650 |
| 2022 | -- | $35,400 | $2,259 | $33,141 |
| 2021 | -- | $31,993 | $2,042 | $29,951 |
| 2020 | $2,206 | $33,148 | $2,116 | $31,032 |
| 2019 | $2,206 | $31,993 | $4,167 | $27,826 |
| 2018 | $2,206 | $31,993 | $4,167 | $27,826 |
| 2017 | $2,206 | $31,993 | $4,167 | $27,826 |
| 2016 | $2,257 | $31,993 | $4,167 | $27,826 |
| 2015 | $2,295 | $31,993 | $4,167 | $27,826 |
| 2014 | $2,295 | $31,993 | $4,167 | $27,826 |
| 2013 | $2,295 | $31,993 | $4,167 | $27,826 |
Source: Public Records
Map
Nearby Homes
- 215 Silver St
- 312 Ashmore Rd
- 512 Norton Dr
- 509 Lakeshore Dr
- 100 N Reel St
- 22518 State Highway 133
- 0 E Co Road 1550 N
- Moody Rd Unit Lot WP001
- County Road 1550 N
- 0 County Road 2300 Rd E Unit 24630606
- 0 County Road 2300 Rd E Unit RMAPA1260552
- 206 S Boyer Ave
- 212 Michigan St
- 18428 E Co Road 1500 N
- 20315 Airtight Rd
- 210 Buena Vista St
- 12 E Walnut St
- 137 E Buena Vista St
- 6 S Oakland Rd
- 509 E Jefferson St
- 306 W Main St
- 6 N Logan St
- 223 E Main St
- 222 E Main St
- 104 N Logan St
- 103 N Logan St
- 218 E Main St
- 312 E Montgomery St
- 219 E Montgomery St
- 112 N Logan St
- 111 N Logan St
- 215 E Montgomery St
- 214 E Main St
- 116 N Logan St
- 212 E Main St
- 213 E Montgomery St
- 115 N Logan St
- 115 N Teeter St
- 212 E Montgomery St
- 112 N Teeter St