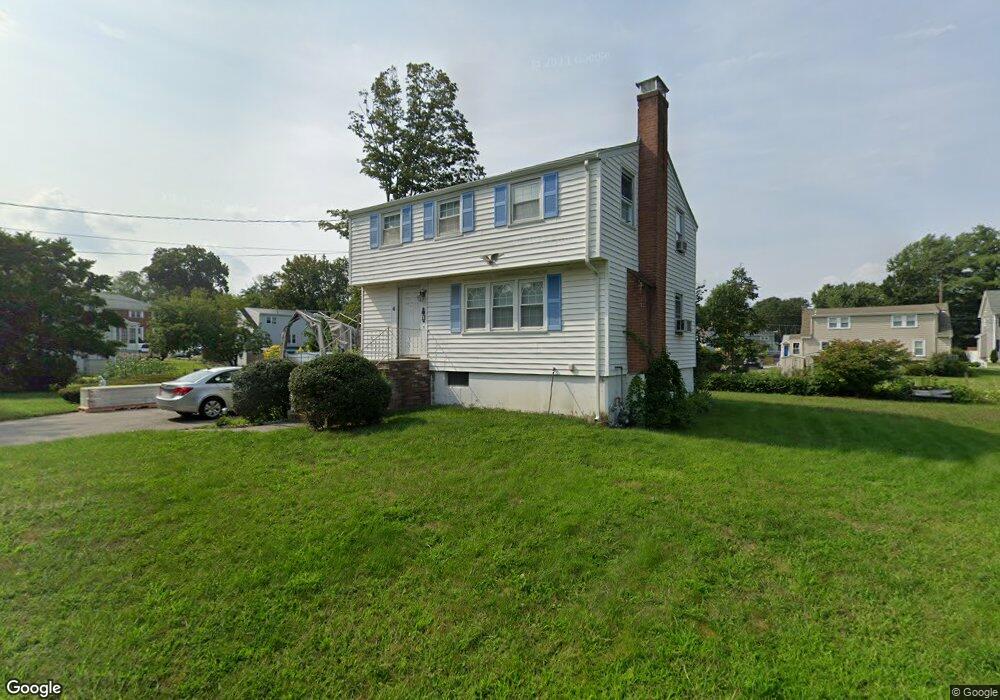
4 Newbridge Ave Burlington, MA 01803
Winnmere NeighborhoodEstimated Value: $680,000 - $754,996
3
Beds
2
Baths
1,274
Sq Ft
$563/Sq Ft
Est. Value
About This Home
This home is located at 4 Newbridge Ave, Burlington, MA 01803 and is currently estimated at $717,749, approximately $563 per square foot. 4 Newbridge Ave is a home located in Middlesex County with nearby schools including Burlington High School, Marshall Simonds Middle School, and St. Charles Elementary School.
Ownership History
Date
Name
Owned For
Owner Type
Purchase Details
Closed on
Sep 17, 2003
Sold by
Mcmakin William B and Mcmakin Mary V
Bought by
Mcmakin Mary V and Mcmakin Ann Marie
Current Estimated Value
Create a Home Valuation Report for This Property
The Home Valuation Report is an in-depth analysis detailing your home's value as well as a comparison with similar homes in the area
Home Values in the Area
Average Home Value in this Area
Purchase History
| Date | Buyer | Sale Price | Title Company |
|---|---|---|---|
| Mcmakin Mary V | -- | -- |
Source: Public Records
Tax History Compared to Growth
Tax History
| Year | Tax Paid | Tax Assessment Tax Assessment Total Assessment is a certain percentage of the fair market value that is determined by local assessors to be the total taxable value of land and additions on the property. | Land | Improvement |
|---|---|---|---|---|
| 2025 | $5,530 | $638,600 | $413,000 | $225,600 |
| 2024 | $5,289 | $591,600 | $377,100 | $214,500 |
| 2023 | $5,042 | $536,400 | $326,800 | $209,600 |
| 2022 | $4,886 | $491,100 | $297,200 | $193,900 |
| 2021 | $11,443 | $472,200 | $278,300 | $193,900 |
| 2020 | $11,553 | $464,700 | $273,800 | $190,900 |
| 2019 | $4,396 | $419,500 | $255,900 | $163,600 |
| 2018 | $6,448 | $405,300 | $248,700 | $156,600 |
| 2017 | $4,166 | $405,300 | $248,700 | $156,600 |
| 2016 | $4,122 | $359,700 | $215,500 | $144,200 |
| 2015 | $4,083 | $359,700 | $215,500 | $144,200 |
| 2014 | $3,931 | $327,600 | $192,100 | $135,500 |
Source: Public Records
Map
Nearby Homes
- 4 Ardmore Ave
- 29 Overlook Ave
- 29 Grove Ln Unit 29
- 50 Hill Cir
- 12 Cassidy Dr
- 16 Sunnyside Rd
- 23 Ward St Unit A
- 6 Kendal Dr
- 17 Wright St
- 18 Hamilton Rd
- 68 Hammond Place Unit 68
- 19 Hammond Place Unit 19
- 846 Main St
- 6 Tidd Ave
- 6R & 6 Tidd Ave
- 129 Cambridge St Unit 1
- 36 Cambridge Rd Unit 40
- 210 Winn St
- 462 Place Ln
- 166 Place Ln Unit 166