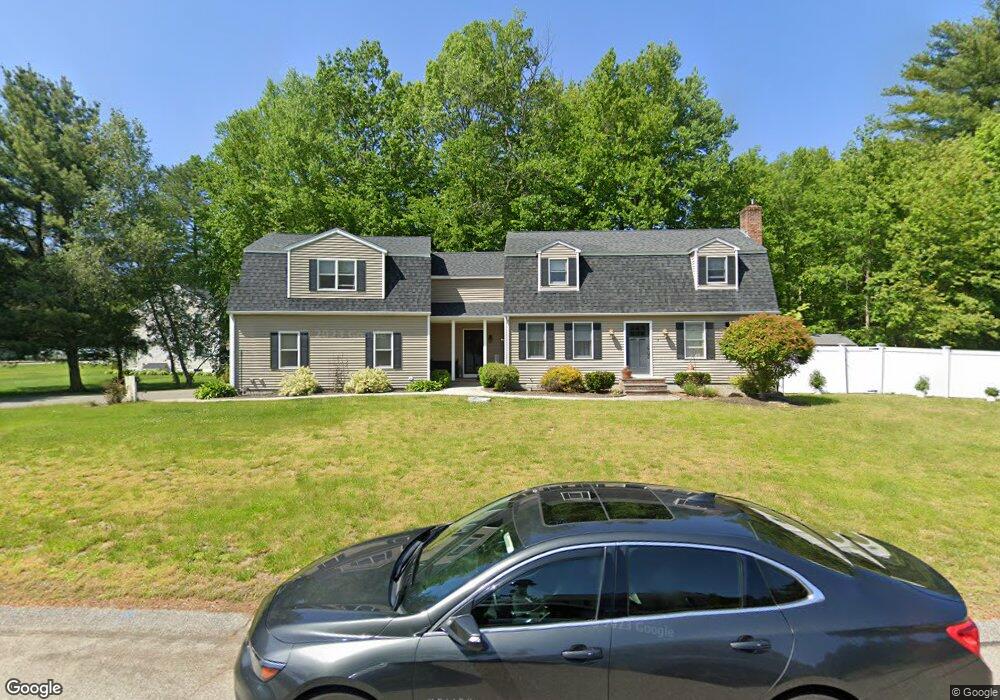
4 No Way Uxbridge, MA 01569
Estimated Value: $604,000 - $655,201
3
Beds
2
Baths
1,550
Sq Ft
$405/Sq Ft
Est. Value
About This Home
This home is located at 4 No Way, Uxbridge, MA 01569 and is currently estimated at $627,550, approximately $404 per square foot. 4 No Way is a home located in Worcester County with nearby schools including Uxbridge High School and Our Lady of the Valley Regional School.
Ownership History
Date
Name
Owned For
Owner Type
Purchase Details
Closed on
Sep 10, 2004
Sold by
Moore Sheila B
Bought by
Tognazzi Maryann
Current Estimated Value
Home Financials for this Owner
Home Financials are based on the most recent Mortgage that was taken out on this home.
Original Mortgage
$194,700
Interest Rate
6.08%
Mortgage Type
Purchase Money Mortgage
Purchase Details
Closed on
Jun 29, 2001
Sold by
Cotter John J and Cotter Patricia J
Bought by
Moore Sheila B
Create a Home Valuation Report for This Property
The Home Valuation Report is an in-depth analysis detailing your home's value as well as a comparison with similar homes in the area
Home Values in the Area
Average Home Value in this Area
Purchase History
| Date | Buyer | Sale Price | Title Company |
|---|---|---|---|
| Tognazzi Maryann | $326,000 | -- | |
| Moore Sheila B | $248,900 | -- |
Source: Public Records
Mortgage History
| Date | Status | Borrower | Loan Amount |
|---|---|---|---|
| Open | Moore Sheila B | $225,000 | |
| Closed | Moore Sheila B | $202,500 | |
| Closed | Tognazzi Maryann | $194,700 | |
| Previous Owner | Moore Sheila B | $226,000 | |
| Previous Owner | Moore Sheila B | $25,000 |
Source: Public Records
Tax History Compared to Growth
Tax History
| Year | Tax Paid | Tax Assessment Tax Assessment Total Assessment is a certain percentage of the fair market value that is determined by local assessors to be the total taxable value of land and additions on the property. | Land | Improvement |
|---|---|---|---|---|
| 2025 | $75 | $574,600 | $153,000 | $421,600 |
| 2024 | $7,149 | $553,300 | $145,200 | $408,100 |
| 2023 | $6,817 | $488,700 | $125,600 | $363,100 |
| 2022 | $6,172 | $407,100 | $109,900 | $297,200 |
| 2021 | $6,402 | $404,700 | $107,500 | $297,200 |
| 2020 | $7,093 | $423,700 | $106,000 | $317,700 |
| 2019 | $6,968 | $401,600 | $106,000 | $295,600 |
| 2018 | $6,353 | $370,000 | $106,000 | $264,000 |
| 2017 | $5,975 | $352,300 | $103,600 | $248,700 |
| 2016 | $5,665 | $322,400 | $95,000 | $227,400 |
| 2015 | $5,530 | $317,800 | $95,000 | $222,800 |
Source: Public Records
Map
Nearby Homes
- 14 Woodland Rd
- 371 Hartford Ave E
- 46 Pouts Ln Unit 46
- 256 Mendon St
- 107 Henry St
- 20 Nature View Dr Unit 20
- 24 Olde Canal Way Unit 24
- 37 Elizabeth St
- 13A Asylum St
- 230 Quaker St
- 72 Homeward Ave
- 75 Lake St
- 50 Carrington Ln
- 4 Strathmore Shire Dr Unit B
- 3 Strathmore Shire Unit A
- 48 Homeward Ave
- 286 Blackstone St
- 44 Arthur Dr Unit 44
- 33 Seagrave St
- 27 Taft Ave