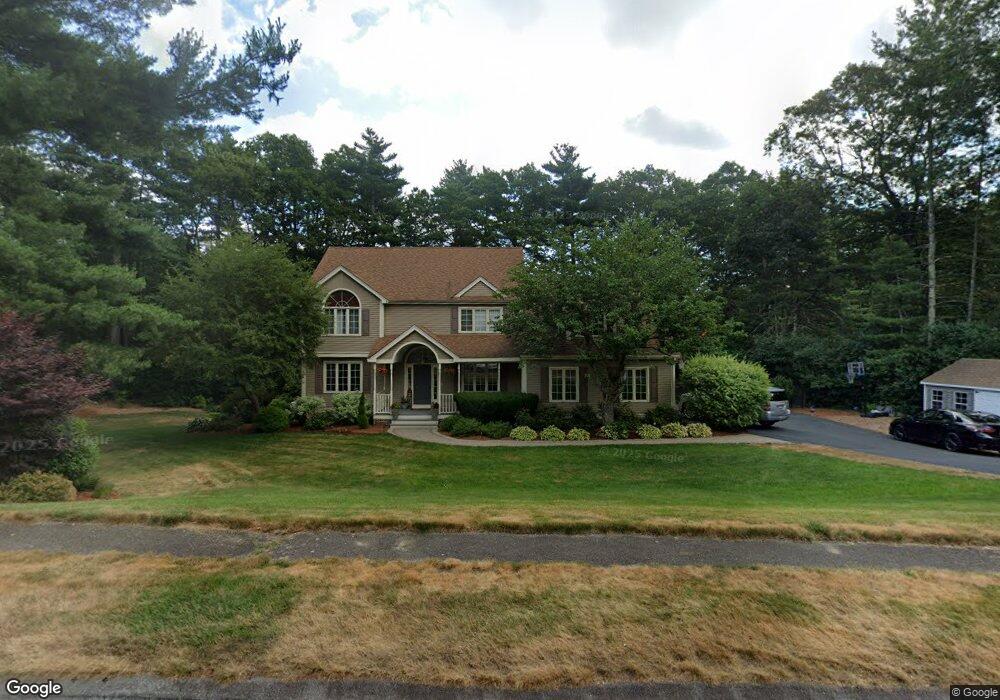
4 Norton St Foxboro, MA 02035
Estimated Value: $962,000 - $1,436,000
4
Beds
4
Baths
2,950
Sq Ft
$377/Sq Ft
Est. Value
About This Home
This home is located at 4 Norton St, Foxboro, MA 02035 and is currently estimated at $1,112,240, approximately $377 per square foot. 4 Norton St is a home located in Norfolk County with nearby schools including Foxborough High School, Foxborough Regional Charter School, and Cadence Academy Preschool - North Attleborough.
Ownership History
Date
Name
Owned For
Owner Type
Purchase Details
Closed on
Feb 13, 2020
Sold by
Morin Jason A
Bought by
Morin Jason A and Morin Jaimie L
Current Estimated Value
Purchase Details
Closed on
Jul 3, 1995
Sold by
Morin Jason A
Bought by
Superior Bldg Assoc
Create a Home Valuation Report for This Property
The Home Valuation Report is an in-depth analysis detailing your home's value as well as a comparison with similar homes in the area
Home Values in the Area
Average Home Value in this Area
Purchase History
| Date | Buyer | Sale Price | Title Company |
|---|---|---|---|
| Morin Jason A | -- | None Available | |
| Superior Bldg Assoc | $320,000 | -- |
Source: Public Records
Mortgage History
| Date | Status | Borrower | Loan Amount |
|---|---|---|---|
| Previous Owner | Superior Bldg Assoc | $100,000 |
Source: Public Records
Tax History Compared to Growth
Tax History
| Year | Tax Paid | Tax Assessment Tax Assessment Total Assessment is a certain percentage of the fair market value that is determined by local assessors to be the total taxable value of land and additions on the property. | Land | Improvement |
|---|---|---|---|---|
| 2025 | $11,759 | $889,500 | $314,500 | $575,000 |
| 2024 | $10,901 | $806,900 | $288,300 | $518,600 |
| 2023 | $10,211 | $718,600 | $274,700 | $443,900 |
| 2022 | $9,969 | $686,600 | $256,400 | $430,200 |
| 2021 | $9,752 | $661,600 | $249,900 | $411,700 |
| 2020 | $9,447 | $648,400 | $249,900 | $398,500 |
| 2019 | $9,423 | $641,000 | $268,900 | $372,100 |
| 2018 | $9,347 | $641,500 | $279,300 | $362,200 |
| 2017 | $9,171 | $609,800 | $270,600 | $339,200 |
| 2016 | $9,073 | $612,200 | $265,900 | $346,300 |
| 2015 | $8,745 | $575,700 | $212,600 | $363,100 |
| 2014 | $8,529 | $569,000 | $212,600 | $356,400 |
Source: Public Records
Map
Nearby Homes
- 16 Treasure Island Rd
- 24 Maverick Dr
- 406 South St
- 9 Oak Dr
- 116 George St
- 28 Messenger St
- 126 Washington St
- 130 Washington St
- 124 Washington St
- 158 Washington St
- 160 Washington St Unit 36
- 10 Sleepy Hollow Cir
- 4 Buckskin Dr
- 11 Landry Ave
- 47 Old Farm Rd
- 80 Mill St
- 5 Old Wood Rd
- 15 Old Wood Rd
- 150 Gilbert St
- 9 Sunnyside Dr Unit 9