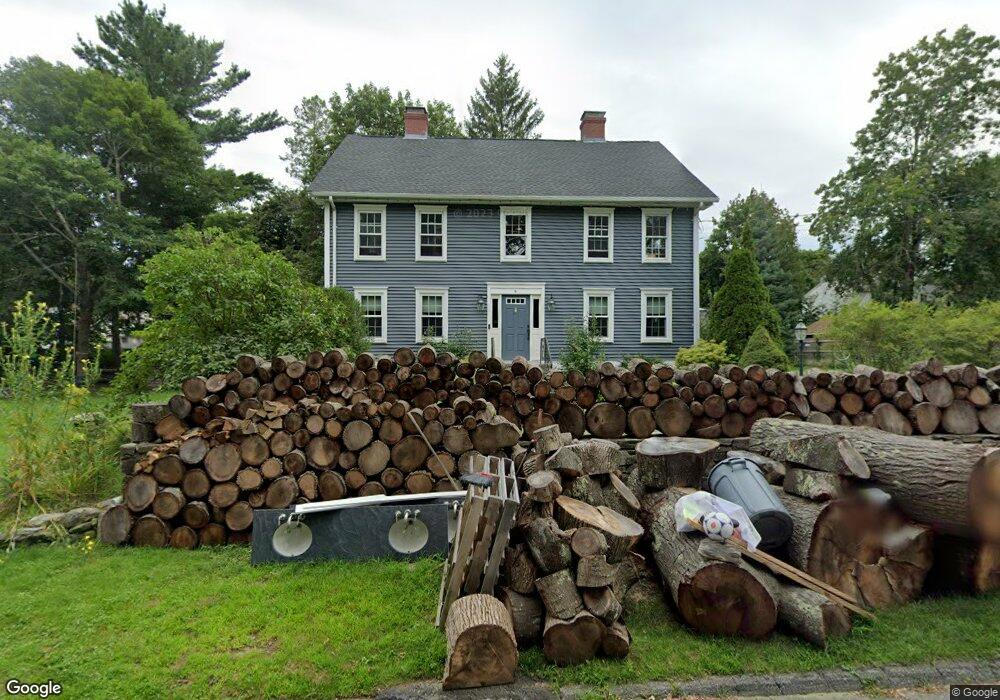
4 Norwood Ave Shrewsbury, MA 01545
Estimated Value: $644,000 - $729,000
3
Beds
2
Baths
2,220
Sq Ft
$304/Sq Ft
Est. Value
About This Home
This home is located at 4 Norwood Ave, Shrewsbury, MA 01545 and is currently estimated at $674,912, approximately $304 per square foot. 4 Norwood Ave is a home located in Worcester County with nearby schools including Floral Street School, Sherwood Middle School, and Oak Middle School.
Ownership History
Date
Name
Owned For
Owner Type
Purchase Details
Closed on
Jun 29, 2020
Sold by
Droege Barbara E and Droege Richard E
Bought by
Santello Justin and Santello Danielle
Current Estimated Value
Home Financials for this Owner
Home Financials are based on the most recent Mortgage that was taken out on this home.
Original Mortgage
$336,000
Outstanding Balance
$297,179
Interest Rate
3.2%
Mortgage Type
New Conventional
Estimated Equity
$377,733
Create a Home Valuation Report for This Property
The Home Valuation Report is an in-depth analysis detailing your home's value as well as a comparison with similar homes in the area
Home Values in the Area
Average Home Value in this Area
Purchase History
| Date | Buyer | Sale Price | Title Company |
|---|---|---|---|
| Santello Justin | $420,000 | None Available |
Source: Public Records
Mortgage History
| Date | Status | Borrower | Loan Amount |
|---|---|---|---|
| Open | Santello Justin | $336,000 | |
| Closed | Santello Justin | $336,000 |
Source: Public Records
Tax History Compared to Growth
Tax History
| Year | Tax Paid | Tax Assessment Tax Assessment Total Assessment is a certain percentage of the fair market value that is determined by local assessors to be the total taxable value of land and additions on the property. | Land | Improvement |
|---|---|---|---|---|
| 2025 | $68 | $560,600 | $259,900 | $300,700 |
| 2024 | $6,662 | $538,100 | $247,500 | $290,600 |
| 2023 | $6,417 | $489,100 | $247,500 | $241,600 |
| 2022 | $6,338 | $449,200 | $247,500 | $201,700 |
| 2021 | $5,079 | $385,100 | $198,000 | $187,100 |
| 2020 | $4,938 | $396,000 | $198,000 | $198,000 |
| 2019 | $4,721 | $375,600 | $181,600 | $194,000 |
| 2018 | $4,409 | $348,300 | $174,000 | $174,300 |
| 2017 | $4,158 | $324,100 | $157,500 | $166,600 |
| 2016 | $4,083 | $314,100 | $147,500 | $166,600 |
| 2015 | $4,081 | $309,200 | $142,600 | $166,600 |
Source: Public Records
Map
Nearby Homes