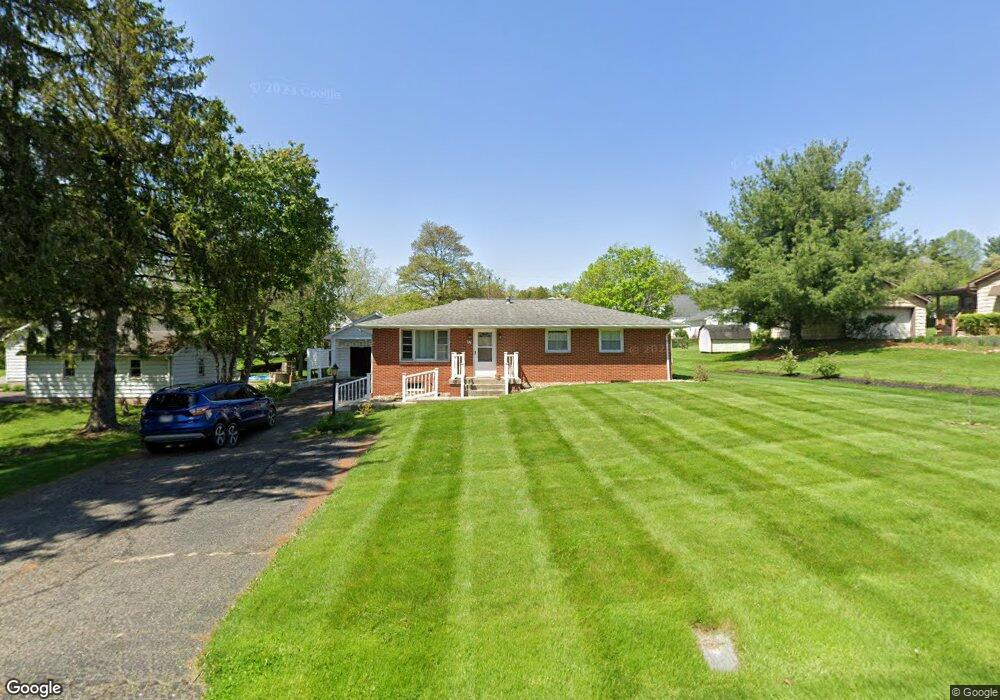
4 Orchard Dr Mount Vernon, OH 43050
Estimated Value: $240,000 - $289,000
2
Beds
2
Baths
1,196
Sq Ft
$223/Sq Ft
Est. Value
About This Home
This home is located at 4 Orchard Dr, Mount Vernon, OH 43050 and is currently estimated at $266,485, approximately $222 per square foot. 4 Orchard Dr is a home located in Knox County with nearby schools including Mount Vernon High School, St. Vincent de Paul School, and Christian Star Academy.
Ownership History
Date
Name
Owned For
Owner Type
Purchase Details
Closed on
May 29, 2025
Sold by
Heffernan Daniel A and Heffernan Rachael Y
Bought by
Heffernan Preservation Trust and Heffernan
Current Estimated Value
Purchase Details
Closed on
Jun 30, 2016
Sold by
Mayer Robert and Desmond Terri
Bought by
Heffernan Daniel and Heffernan Rachael
Purchase Details
Closed on
Jan 6, 2016
Sold by
Mayer Robert Paul
Bought by
Mayer Robert and Desmond Terri
Purchase Details
Closed on
Jan 18, 2011
Sold by
Mayer Joseph and Mayer Joseph R
Bought by
Mayer Joseph R
Purchase Details
Closed on
Jan 1, 1987
Bought by
Mayer Joseph
Create a Home Valuation Report for This Property
The Home Valuation Report is an in-depth analysis detailing your home's value as well as a comparison with similar homes in the area
Home Values in the Area
Average Home Value in this Area
Purchase History
| Date | Buyer | Sale Price | Title Company |
|---|---|---|---|
| Heffernan Preservation Trust | -- | None Listed On Document | |
| Heffernan Daniel | $84,600 | None Available | |
| Mayer Robert | -- | None Available | |
| Mayer Joseph R | -- | None Available | |
| Mayer Joseph | -- | -- |
Source: Public Records
Tax History Compared to Growth
Tax History
| Year | Tax Paid | Tax Assessment Tax Assessment Total Assessment is a certain percentage of the fair market value that is determined by local assessors to be the total taxable value of land and additions on the property. | Land | Improvement |
|---|---|---|---|---|
| 2024 | $2,394 | $71,880 | $16,100 | $55,780 |
| 2023 | $2,394 | $71,880 | $16,100 | $55,780 |
| 2022 | $1,728 | $49,570 | $11,100 | $38,470 |
| 2021 | $1,731 | $49,570 | $11,100 | $38,470 |
| 2020 | $1,686 | $49,570 | $11,100 | $38,470 |
| 2019 | $1,376 | $39,780 | $11,070 | $28,710 |
| 2018 | $1,376 | $39,780 | $11,070 | $28,710 |
| 2017 | $1,780 | $39,780 | $11,070 | $28,710 |
| 2016 | $1,652 | $36,840 | $10,250 | $26,590 |
| 2015 | $1,231 | $36,840 | $10,250 | $26,590 |
| 2014 | $1,269 | $36,840 | $10,250 | $26,590 |
| 2013 | $1,327 | $37,400 | $9,630 | $27,770 |
Source: Public Records
Map
Nearby Homes