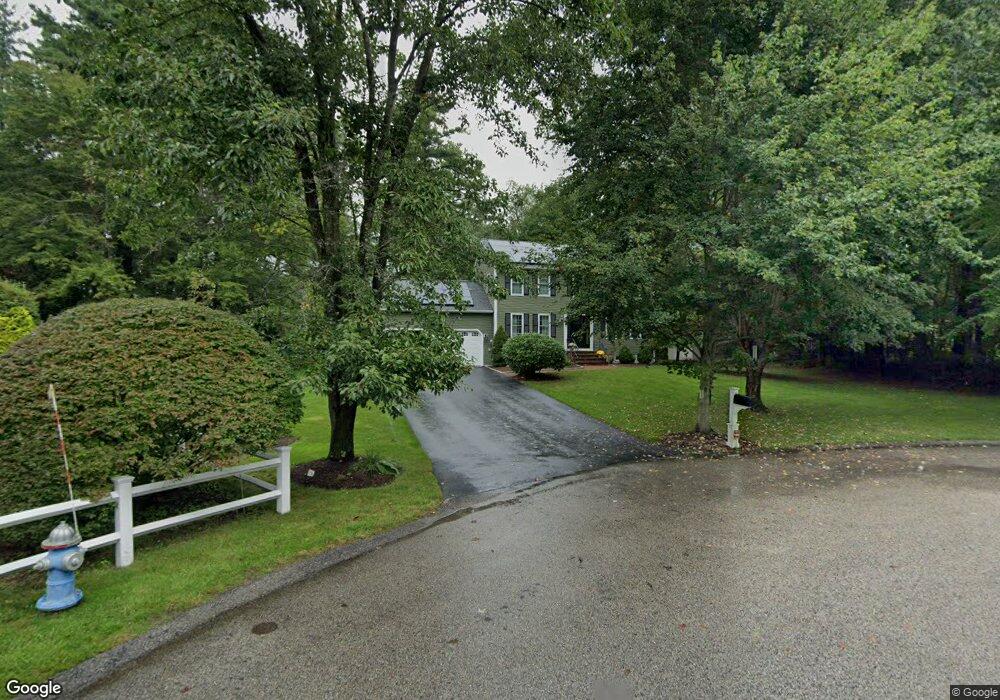
4 Orchard St Medway, MA 02053
Estimated Value: $739,118 - $847,000
3
Beds
3
Baths
2,228
Sq Ft
$351/Sq Ft
Est. Value
About This Home
This home is located at 4 Orchard St, Medway, MA 02053 and is currently estimated at $782,030, approximately $351 per square foot. 4 Orchard St is a home located in Norfolk County with nearby schools including John D. McGovern Elementary School, Burke-Memorial Elementary, and Medway Middle School.
Ownership History
Date
Name
Owned For
Owner Type
Purchase Details
Closed on
Feb 10, 2020
Sold by
Leclair Filipa and Leclair Michael
Bought by
Leclair Filipa
Current Estimated Value
Home Financials for this Owner
Home Financials are based on the most recent Mortgage that was taken out on this home.
Original Mortgage
$366,000
Outstanding Balance
$322,682
Interest Rate
3.6%
Mortgage Type
New Conventional
Estimated Equity
$459,348
Purchase Details
Closed on
Jun 29, 2010
Sold by
Mintz Scott M and Mintz Virginia A
Bought by
Leclair Michael and Leclair Filipa
Home Financials for this Owner
Home Financials are based on the most recent Mortgage that was taken out on this home.
Original Mortgage
$335,920
Interest Rate
4.98%
Mortgage Type
Purchase Money Mortgage
Create a Home Valuation Report for This Property
The Home Valuation Report is an in-depth analysis detailing your home's value as well as a comparison with similar homes in the area
Home Values in the Area
Average Home Value in this Area
Purchase History
| Date | Buyer | Sale Price | Title Company |
|---|---|---|---|
| Leclair Filipa | -- | None Available | |
| Leclair Michael | $419,900 | -- | |
| Leclair Michael | $419,900 | -- |
Source: Public Records
Mortgage History
| Date | Status | Borrower | Loan Amount |
|---|---|---|---|
| Open | Leclair Filipa | $366,000 | |
| Previous Owner | Leclair Michael | $335,920 |
Source: Public Records
Tax History Compared to Growth
Tax History
| Year | Tax Paid | Tax Assessment Tax Assessment Total Assessment is a certain percentage of the fair market value that is determined by local assessors to be the total taxable value of land and additions on the property. | Land | Improvement |
|---|---|---|---|---|
| 2025 | $9,436 | $662,200 | $290,200 | $372,000 |
| 2024 | $9,536 | $662,200 | $290,200 | $372,000 |
| 2023 | $9,027 | $566,300 | $240,400 | $325,900 |
| 2022 | $8,775 | $518,300 | $213,500 | $304,800 |
| 2021 | $8,513 | $487,600 | $196,900 | $290,700 |
| 2020 | $8,106 | $463,200 | $182,400 | $280,800 |
| 2019 | $7,793 | $459,200 | $182,400 | $276,800 |
| 2018 | $7,857 | $444,900 | $174,100 | $270,800 |
| 2017 | $7,790 | $434,700 | $167,900 | $266,800 |
| 2016 | $7,360 | $406,400 | $161,700 | $244,700 |
| 2015 | $6,991 | $383,300 | $149,200 | $234,100 |
| 2014 | $7,140 | $379,000 | $149,200 | $229,800 |
Source: Public Records
Map
Nearby Homes
- 22 Sunset Dr
- 14 Heritage Dr
- 3 Meryl St
- 12 Lovering St
- 36 Lovering St
- 280 Village St Unit D2
- 106 Holliston St
- 50 Main St
- 4 Shaw St
- 176 Main St Unit 3
- 28 Wellington St
- 20 Broad St Unit 6
- 20 Broad St Unit A
- 20 Broad St Unit 4
- 14 Sanford St Unit 15
- 9 Sanford St
- 220 Main St Unit 220
- 5 Fales St
- 21 Riverside Rd
- 6 Freedom Trail
- 5 Orchard St
- 2 Orchard St
- 3 Orchard St
- 20 Malloy St
- 1 Orchard St
- 89 Main St Unit 101
- 89 Main St Unit D
- 89 Main St Unit 214
- 89 Main St Unit 111
- 89 Main St Unit 109
- 89 Main St Unit 205
- 89 Main St Unit B
- 89 Main St Unit 107
- 89 Main St Unit 204
- 89 Main St Unit 302
- 89 Main St Unit 215
- 89 Main St Unit 206
- 89 Main St Unit 300
- 89 Main St Unit 306
- 89 Main St Unit C/D