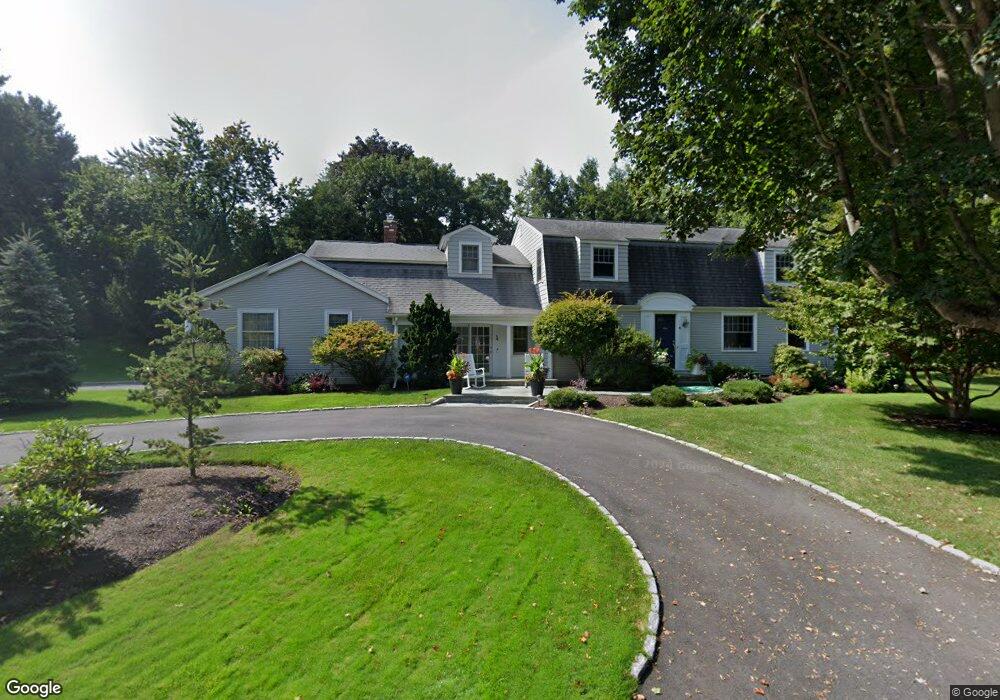
4 Overlook Rd Barrington, RI 02806
Nayatt NeighborhoodEstimated Value: $1,457,000 - $1,690,000
4
Beds
3
Baths
3,092
Sq Ft
$506/Sq Ft
Est. Value
About This Home
This home is located at 4 Overlook Rd, Barrington, RI 02806 and is currently estimated at $1,564,404, approximately $505 per square foot. 4 Overlook Rd is a home located in Bristol County with nearby schools including Barrington High School, St Luke Elementary School, and Barrington Christian Academy.
Ownership History
Date
Name
Owned For
Owner Type
Purchase Details
Closed on
Dec 2, 2010
Sold by
Karlson Eric J and Karlson Amy E
Bought by
Dosa David M and Dosa Dionne P
Current Estimated Value
Home Financials for this Owner
Home Financials are based on the most recent Mortgage that was taken out on this home.
Original Mortgage
$560,000
Outstanding Balance
$379,866
Interest Rate
4.22%
Mortgage Type
Purchase Money Mortgage
Estimated Equity
$1,184,538
Purchase Details
Closed on
Jan 27, 2003
Sold by
Bucci Alex and Bucci Julia
Bought by
Karlson Eric
Home Financials for this Owner
Home Financials are based on the most recent Mortgage that was taken out on this home.
Original Mortgage
$528,000
Interest Rate
6.11%
Purchase Details
Closed on
Dec 14, 2001
Sold by
Lathrop John C and Lathrop Irene
Bought by
Bucci Alex R and Bucci Julia
Create a Home Valuation Report for This Property
The Home Valuation Report is an in-depth analysis detailing your home's value as well as a comparison with similar homes in the area
Home Values in the Area
Average Home Value in this Area
Purchase History
| Date | Buyer | Sale Price | Title Company |
|---|---|---|---|
| Dosa David M | $700,000 | -- | |
| Karlson Eric | $660,000 | -- | |
| Bucci Alex R | $627,500 | -- |
Source: Public Records
Mortgage History
| Date | Status | Borrower | Loan Amount |
|---|---|---|---|
| Closed | Bucci Alex R | $75,000 | |
| Open | Bucci Alex R | $560,000 | |
| Previous Owner | Bucci Alex R | $365,750 | |
| Previous Owner | Bucci Alex R | $528,000 |
Source: Public Records
Tax History Compared to Growth
Tax History
| Year | Tax Paid | Tax Assessment Tax Assessment Total Assessment is a certain percentage of the fair market value that is determined by local assessors to be the total taxable value of land and additions on the property. | Land | Improvement |
|---|---|---|---|---|
| 2025 | $18,423 | $1,201,000 | $603,000 | $598,000 |
| 2024 | $17,582 | $1,192,000 | $603,000 | $589,000 |
| 2023 | $16,260 | $801,000 | $404,000 | $397,000 |
| 2022 | $15,740 | $801,000 | $404,000 | $397,000 |
| 2021 | $15,339 | $801,000 | $404,000 | $397,000 |
| 2020 | $14,546 | $696,000 | $362,000 | $334,000 |
| 2019 | $13,869 | $690,000 | $362,000 | $328,000 |
| 2018 | $13,455 | $690,000 | $362,000 | $328,000 |
| 2017 | $13,694 | $684,700 | $362,200 | $322,500 |
| 2016 | $12,633 | $684,700 | $362,200 | $322,500 |
| 2015 | $12,496 | $684,700 | $362,200 | $322,500 |
| 2014 | $12,876 | $703,600 | $378,500 | $325,100 |
Source: Public Records
Map
Nearby Homes