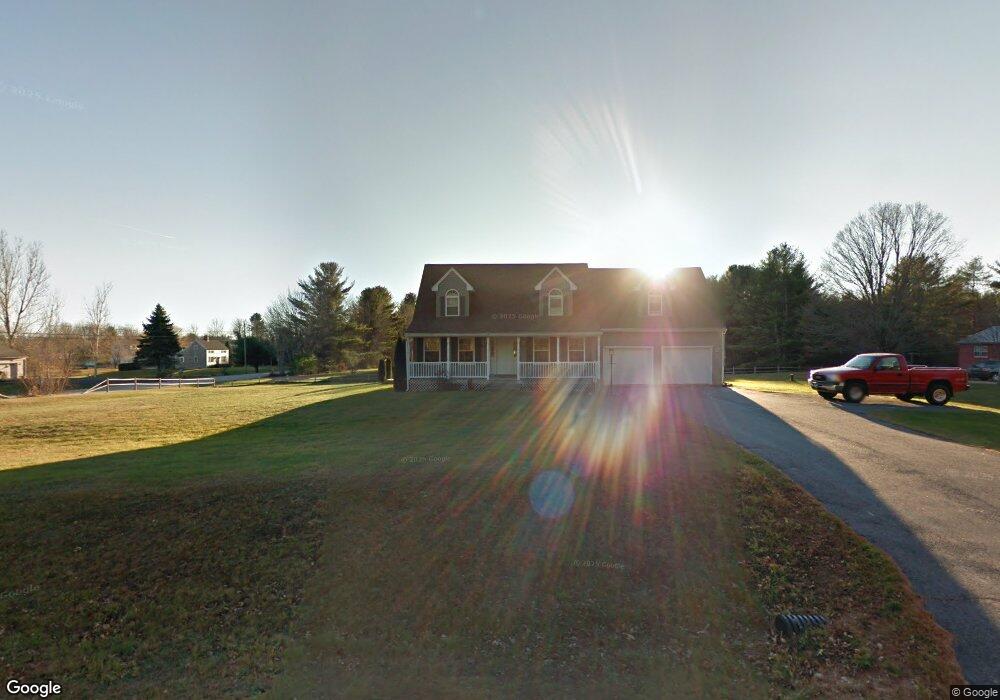
4 Pams Way Gorham, ME 04038
Estimated Value: $559,215 - $617,000
3
Beds
2
Baths
1,400
Sq Ft
$421/Sq Ft
Est. Value
About This Home
This home is located at 4 Pams Way, Gorham, ME 04038 and is currently estimated at $589,554, approximately $421 per square foot. 4 Pams Way is a home located in Cumberland County with nearby schools including Village Elementary School, Gorham High School, and Standish Baptist Academy.
Ownership History
Date
Name
Owned For
Owner Type
Purchase Details
Closed on
Nov 25, 2011
Sold by
Cleary Jesse R
Bought by
Cleary Jesse R and Theriault Melinda
Current Estimated Value
Home Financials for this Owner
Home Financials are based on the most recent Mortgage that was taken out on this home.
Original Mortgage
$214,120
Outstanding Balance
$150,014
Interest Rate
4.75%
Mortgage Type
FHA
Estimated Equity
$439,540
Purchase Details
Closed on
Dec 16, 2008
Sold by
Wells Fargo Bank Na Tr
Bought by
Cleary Jesse R and Cleary Natalie J
Home Financials for this Owner
Home Financials are based on the most recent Mortgage that was taken out on this home.
Original Mortgage
$218,813
Interest Rate
6.49%
Mortgage Type
FHA
Purchase Details
Closed on
Jun 29, 2005
Sold by
Gilbert Homes Inc
Bought by
Coffin Jeffrey S
Home Financials for this Owner
Home Financials are based on the most recent Mortgage that was taken out on this home.
Original Mortgage
$239,120
Interest Rate
5.73%
Mortgage Type
Purchase Money Mortgage
Create a Home Valuation Report for This Property
The Home Valuation Report is an in-depth analysis detailing your home's value as well as a comparison with similar homes in the area
Home Values in the Area
Average Home Value in this Area
Purchase History
| Date | Buyer | Sale Price | Title Company |
|---|---|---|---|
| Cleary Jesse R | -- | -- | |
| Cleary Jesse R | -- | -- | |
| Coffin Jeffrey S | -- | -- |
Source: Public Records
Mortgage History
| Date | Status | Borrower | Loan Amount |
|---|---|---|---|
| Open | Cleary Jesse R | $214,120 | |
| Closed | Cleary Jesse R | $218,813 | |
| Previous Owner | Cleary Jesse R | $0 | |
| Previous Owner | Coffin Jeffrey S | $239,120 | |
| Previous Owner | Coffin Jeffrey S | $59,780 |
Source: Public Records
Tax History Compared to Growth
Tax History
| Year | Tax Paid | Tax Assessment Tax Assessment Total Assessment is a certain percentage of the fair market value that is determined by local assessors to be the total taxable value of land and additions on the property. | Land | Improvement |
|---|---|---|---|---|
| 2024 | $5,723 | $389,300 | $72,700 | $316,600 |
| 2023 | $5,353 | $389,300 | $72,700 | $316,600 |
| 2022 | $5,003 | $389,300 | $72,700 | $316,600 |
| 2021 | $4,400 | $226,800 | $54,700 | $172,100 |
| 2020 | $4,309 | $226,800 | $54,700 | $172,100 |
| 2019 | $4,298 | $226,800 | $54,700 | $172,100 |
| 2018 | $4,128 | $226,800 | $54,700 | $172,100 |
| 2017 | $3,878 | $226,800 | $54,700 | $172,100 |
| 2016 | $3,854 | $226,700 | $54,600 | $172,100 |
| 2015 | $3,695 | $226,700 | $54,600 | $172,100 |
| 2014 | $3,492 | $200,700 | $48,900 | $151,800 |
| 2013 | $3,472 | $200,700 | $48,900 | $151,800 |
Source: Public Records
Map
Nearby Homes
- 21 Alexander Dr
- 183 Buck St
- 135 Buck St
- 14 Patrick Dr
- 00 Ossipee Trail E
- 116 Dingley Spring Rd
- 22 Finn Parker Rd
- 125 Old Thompson Rd
- 35 Rust Rd
- 56 Hay Field Dr
- TBD Fort Hill Rd
- 63 Ossipee Trail E
- 697 Fort Hill Rd
- 66 Ossipee Trail East Trail E
- 27 Ossipee Trail E Unit 1
- 41 Shaws Mill Rd
- 68 Woodbrey Ln
- 66 Woodbrey Ln
- 75 Mighty St
- 8 Cortland Place Unit 5