Estimated Value: $1,175,323 - $1,354,000
3
Beds
3
Baths
2,294
Sq Ft
$544/Sq Ft
Est. Value
About This Home
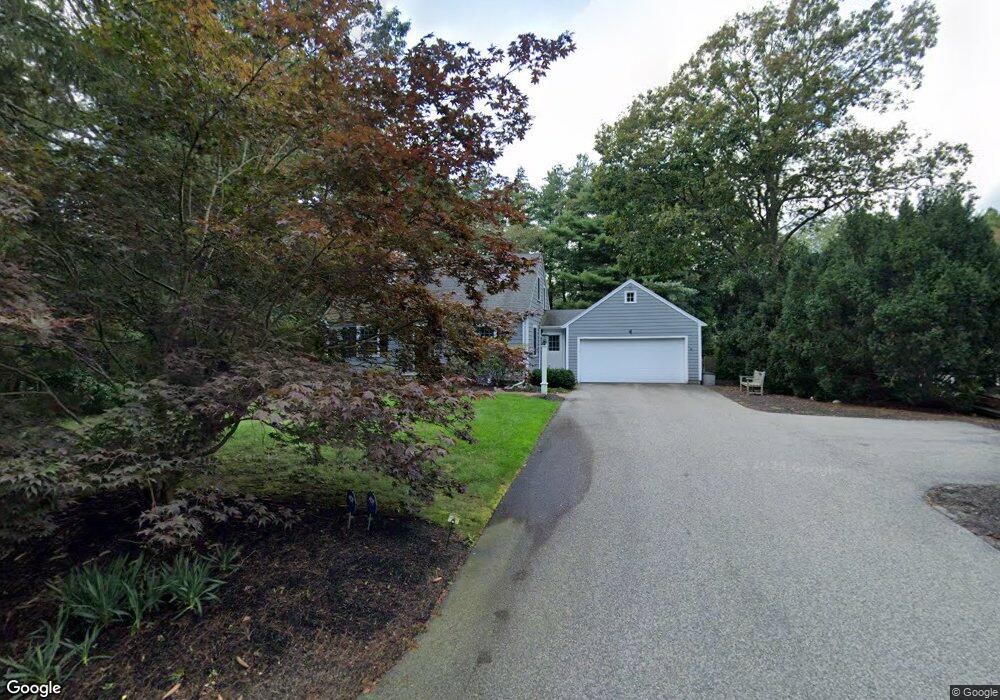
This home is located at 4 Park Ave, Dover, MA 02030 and is currently estimated at $1,247,081, approximately $543 per square foot. 4 Park Ave is a home located in Norfolk County with nearby schools including Chickering Elementary School, Dover-Sherborn Regional Middle School, and Dover-Sherborn Regional High School.
Ownership History
Date
Name
Owned For
Owner Type
Purchase Details
Closed on
Jul 12, 1996
Sold by
Hanley Dean F
Bought by
Handler Jonathan I and Handler Jeidi D
Current Estimated Value
Purchase Details
Closed on
Sep 5, 1989
Sold by
Karr Gregory C
Bought by
Hanley Dean F
Create a Home Valuation Report for This Property
The Home Valuation Report is an in-depth analysis detailing your home's value as well as a comparison with similar homes in the area
Home Values in the Area
Average Home Value in this Area
Purchase History
| Date | Buyer | Sale Price | Title Company |
|---|---|---|---|
| Handler Jonathan I | $309,000 | -- | |
| Hanley Dean F | $272,500 | -- |
Source: Public Records
Mortgage History
| Date | Status | Borrower | Loan Amount |
|---|---|---|---|
| Open | Hanley Dean F | $268,000 | |
| Closed | Hanley Dean F | $268,000 |
Source: Public Records
Tax History
| Year | Tax Paid | Tax Assessment Tax Assessment Total Assessment is a certain percentage of the fair market value that is determined by local assessors to be the total taxable value of land and additions on the property. | Land | Improvement |
|---|---|---|---|---|
| 2025 | $11,036 | $979,200 | $610,900 | $368,300 |
| 2024 | $10,528 | $960,600 | $592,300 | $368,300 |
| 2023 | $10,290 | $844,100 | $526,900 | $317,200 |
| 2022 | $9,948 | $801,000 | $508,200 | $292,800 |
| 2021 | $10,325 | $801,000 | $508,200 | $292,800 |
| 2020 | $10,285 | $801,000 | $508,200 | $292,800 |
| 2019 | $10,357 | $801,000 | $508,200 | $292,800 |
| 2018 | $9,267 | $721,700 | $448,200 | $273,500 |
| 2017 | $8,931 | $684,400 | $410,900 | $273,500 |
| 2016 | $8,878 | $689,300 | $410,900 | $278,400 |
| 2015 | $8,492 | $668,700 | $390,300 | $278,400 |
Source: Public Records
Map
Nearby Homes
- 4 Claybrook Rd
- 25 Bretton Rd
- 55 Willow St
- 62 Claybrook Rd
- 60 Claybrook Rd
- 1 Mill St
- 1 Old Colony Dr
- 46 Charles River St
- 3 Riverside Dr
- 85 Strawberry Hill St
- 42 Troutbrook Rd
- 8 Crestview Rd
- 1780 Central Ave
- 34 Stratford Rd
- 62 Walpole St
- 365 Charles River St
- 65 Walpole St
- 37 Carleton Dr
- 20 Burr Dr
- 49 Powisset St
Your Personal Tour Guide
Ask me questions while you tour the home.