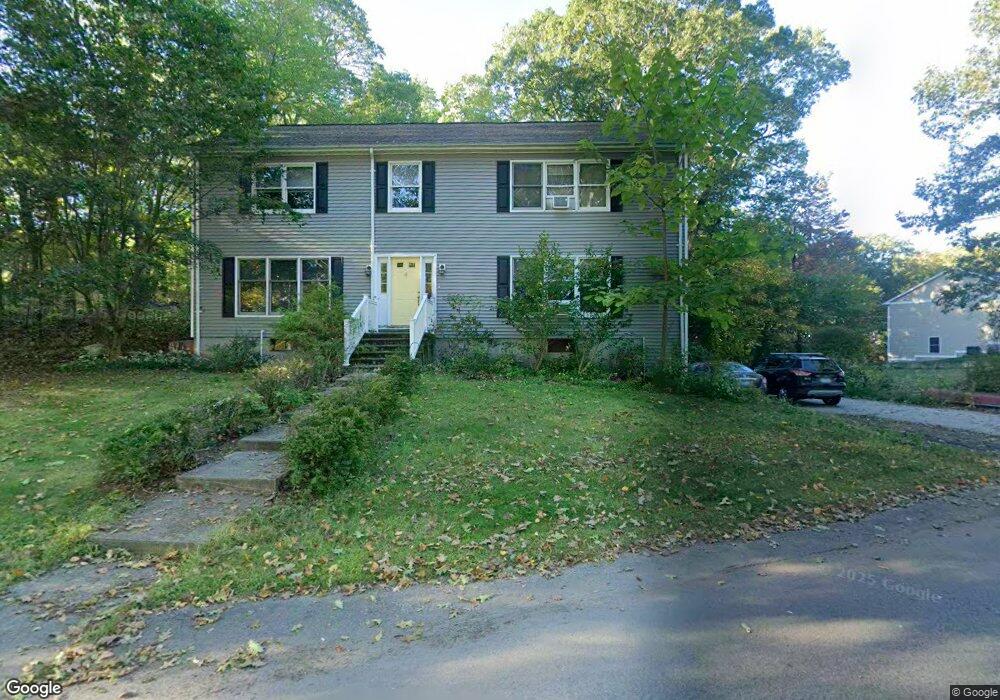
4 Parkview Trail Cumberland, RI 02864
Lippitt Estates NeighborhoodEstimated Value: $641,878 - $781,000
4
Beds
3
Baths
2,688
Sq Ft
$265/Sq Ft
Est. Value
About This Home
This home is located at 4 Parkview Trail, Cumberland, RI 02864 and is currently estimated at $713,220, approximately $265 per square foot. 4 Parkview Trail is a home located in Providence County with nearby schools including Ashton Elementary School, North Cumberland Middle School, and Cumberland High School.
Ownership History
Date
Name
Owned For
Owner Type
Purchase Details
Closed on
Jul 15, 2011
Sold by
Fnma
Bought by
Farley Lori A
Current Estimated Value
Home Financials for this Owner
Home Financials are based on the most recent Mortgage that was taken out on this home.
Original Mortgage
$239,774
Outstanding Balance
$165,501
Interest Rate
4.58%
Mortgage Type
Purchase Money Mortgage
Estimated Equity
$547,719
Purchase Details
Closed on
Jun 28, 2011
Sold by
Macciarola Robert L
Bought by
Federal National Mortgage Association
Home Financials for this Owner
Home Financials are based on the most recent Mortgage that was taken out on this home.
Original Mortgage
$239,774
Outstanding Balance
$165,501
Interest Rate
4.58%
Mortgage Type
Purchase Money Mortgage
Estimated Equity
$547,719
Purchase Details
Closed on
Sep 10, 2002
Sold by
Scanlon Daniel F and Scanlon Gail D
Bought by
Macchiarola Robert L and Deangelis Lynn Ann
Create a Home Valuation Report for This Property
The Home Valuation Report is an in-depth analysis detailing your home's value as well as a comparison with similar homes in the area
Home Values in the Area
Average Home Value in this Area
Purchase History
| Date | Buyer | Sale Price | Title Company |
|---|---|---|---|
| Farley Lori A | $250,000 | -- | |
| Federal National Mortgage Association | $262,569 | -- | |
| Macchiarola Robert L | $270,000 | -- |
Source: Public Records
Mortgage History
| Date | Status | Borrower | Loan Amount |
|---|---|---|---|
| Open | Farley Lori A | $239,774 | |
| Closed | Macchiarola Robert L | $239,774 | |
| Previous Owner | Macchiarola Robert L | $145,900 | |
| Previous Owner | Macchiarola Robert L | $270,000 |
Source: Public Records
Tax History Compared to Growth
Tax History
| Year | Tax Paid | Tax Assessment Tax Assessment Total Assessment is a certain percentage of the fair market value that is determined by local assessors to be the total taxable value of land and additions on the property. | Land | Improvement |
|---|---|---|---|---|
| 2025 | $5,728 | $466,800 | $107,200 | $359,600 |
| 2024 | $5,578 | $466,800 | $107,200 | $359,600 |
| 2023 | $5,424 | $466,800 | $107,200 | $359,600 |
| 2022 | $5,242 | $349,700 | $78,600 | $271,100 |
| 2021 | $5,155 | $349,700 | $78,600 | $271,100 |
| 2020 | $5,008 | $349,700 | $78,600 | $271,100 |
| 2019 | $4,910 | $309,200 | $67,800 | $241,400 |
| 2018 | $4,768 | $309,200 | $67,800 | $241,400 |
| 2017 | $4,703 | $309,200 | $67,800 | $241,400 |
| 2016 | $5,180 | $303,300 | $72,200 | $231,100 |
| 2015 | $5,180 | $303,300 | $72,200 | $231,100 |
| 2014 | $5,180 | $303,300 | $72,200 | $231,100 |
| 2013 | $4,736 | $300,100 | $72,200 | $227,900 |
Source: Public Records
Map
Nearby Homes
- 45 Leigh Rd
- 140 Lippitt Ave
- 27 Oxford Rd
- 11 Club Dr
- 16 Palomino Dr
- 164 Scott Rd
- 56 Greenfield Rd
- 30 Bear Hill Rd
- 73 Scott Rd
- 1504 Hunting Hill Dr
- 1503 Hunting Hill Dr
- 1501 Hunting Hill Dr
- 160 Shirley Dr
- 1302 Hunting Hill Dr
- 15 Standring St
- 16 Hillside Rd
- 154 Bear Hill Rd Unit 405
- 3070 Diamond Hill Rd
- 140 Abbott Run Valley Rd
- 16 Tallyho Rd
- 4 Park View Trail
- 7 Parkview Trail
- 1 Parkview Trail
- 94 Summit Rd Unit 94
- 45 Summit Rd
- 55 Summit Rd
- 46 Summit Rd
- 14 Parkview Trail
- 12 Parkview Trail
- 33 Summit Rd
- 142 Leigh Rd
- 17 Parkview Trail
- 134 Leigh Rd
- 16 Parkview Trail
- 97 Summit Rd Unit 97
- 130 Leigh Rd
- 22 Cross Rd
- 162 Leigh Rd
- 150 Leigh Rd
- 11 Cross Rd