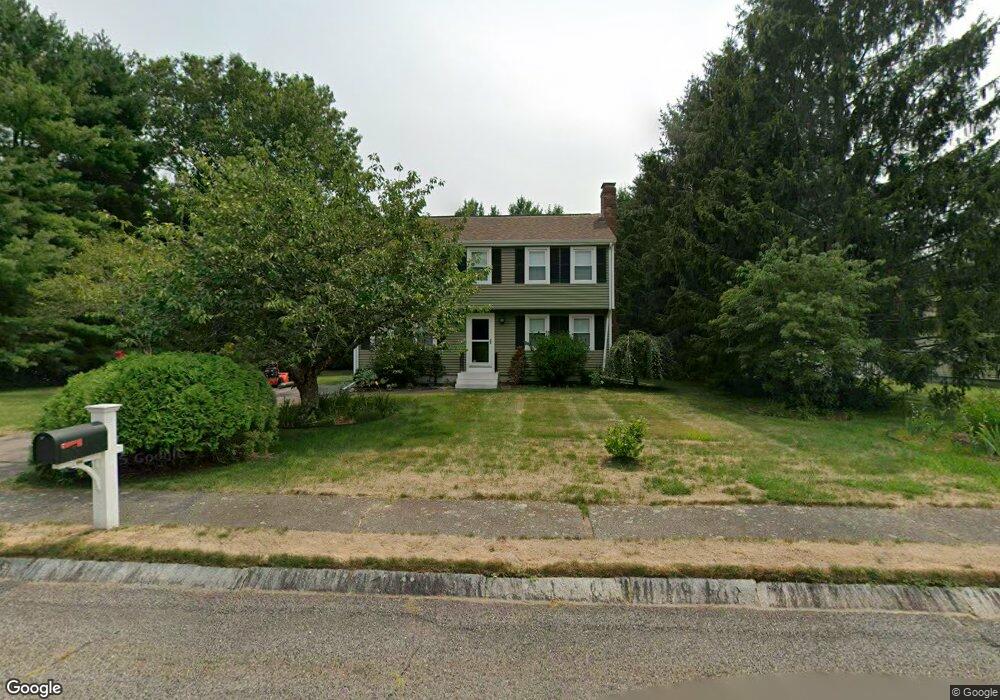
4 Partridge Ln Mansfield, MA 02048
Estimated Value: $664,000 - $712,000
4
Beds
3
Baths
1,700
Sq Ft
$409/Sq Ft
Est. Value
About This Home
This home is located at 4 Partridge Ln, Mansfield, MA 02048 and is currently estimated at $695,789, approximately $409 per square foot. 4 Partridge Ln is a home located in Bristol County with nearby schools including Everett W. Robinson Elementary School, Jordan/Jackson Elementary School, and Harold L. Qualters Middle School.
Ownership History
Date
Name
Owned For
Owner Type
Purchase Details
Closed on
Aug 31, 1992
Sold by
Anello Joseph A and Anello Nancy
Bought by
Mohan Rajinder and Mohan Mamta
Current Estimated Value
Home Financials for this Owner
Home Financials are based on the most recent Mortgage that was taken out on this home.
Original Mortgage
$156,000
Interest Rate
8.09%
Mortgage Type
Purchase Money Mortgage
Create a Home Valuation Report for This Property
The Home Valuation Report is an in-depth analysis detailing your home's value as well as a comparison with similar homes in the area
Home Values in the Area
Average Home Value in this Area
Purchase History
| Date | Buyer | Sale Price | Title Company |
|---|---|---|---|
| Mohan Rajinder | $164,500 | -- |
Source: Public Records
Mortgage History
| Date | Status | Borrower | Loan Amount |
|---|---|---|---|
| Open | Mohan Rajinder | $160,000 | |
| Closed | Mohan Rajinder | $160,000 | |
| Closed | Mohan Rajinder | $156,000 | |
| Previous Owner | Mohan Rajinder | $40,000 |
Source: Public Records
Tax History Compared to Growth
Tax History
| Year | Tax Paid | Tax Assessment Tax Assessment Total Assessment is a certain percentage of the fair market value that is determined by local assessors to be the total taxable value of land and additions on the property. | Land | Improvement |
|---|---|---|---|---|
| 2025 | $7,542 | $572,700 | $278,100 | $294,600 |
| 2024 | $7,556 | $559,700 | $290,200 | $269,500 |
| 2023 | $7,409 | $525,800 | $290,200 | $235,600 |
| 2022 | $7,165 | $472,300 | $268,600 | $203,700 |
| 2021 | $6,843 | $445,500 | $224,000 | $221,500 |
| 2020 | $6,752 | $439,600 | $224,000 | $215,600 |
| 2019 | $6,150 | $404,100 | $186,500 | $217,600 |
| 2018 | $5,772 | $391,600 | $177,900 | $213,700 |
| 2017 | $5,717 | $380,600 | $172,800 | $207,800 |
| 2016 | $5,497 | $356,700 | $164,500 | $192,200 |
| 2015 | $5,379 | $347,000 | $164,500 | $182,500 |
Source: Public Records
Map
Nearby Homes
- 37 Oakleaf Dr
- 2 Oak St Unit 2D
- 2 Oak St Unit 2A
- 2 Oak St Unit 2C
- 2 Oak St Unit 2B
- 451R Gilbert St
- 9 Larson Farm Dr
- 176 Elm St
- 14 Country Club Way
- 150 Gilbert St
- 4 Village Way Unit F
- 250 Mansfield Ave Unit 66
- 4 Buckskin Dr
- 47 Old Farm Rd
- 50 Kimberly Dr
- 19 Precourt Ln
- 157 Mansfield Ave Unit 14
- 15 Reservoir St Unit 44
- 933 Pleasant St
- 136 Lindsey St