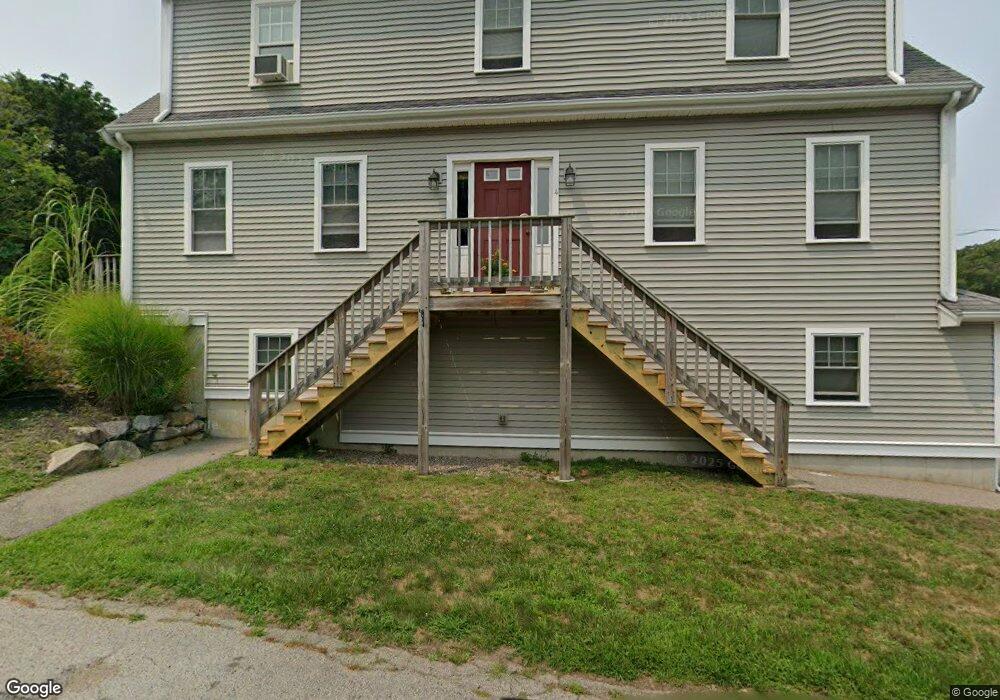
4 Peggy Ln Marshfield, MA 02050
Estimated Value: $781,000 - $988,000
3
Beds
2
Baths
1,800
Sq Ft
$484/Sq Ft
Est. Value
About This Home
This home is located at 4 Peggy Ln, Marshfield, MA 02050 and is currently estimated at $871,860, approximately $484 per square foot. 4 Peggy Ln is a home located in Plymouth County with nearby schools including Eames Way School, Furnace Brook Middle School, and Marshfield High School.
Ownership History
Date
Name
Owned For
Owner Type
Purchase Details
Closed on
Apr 30, 2013
Sold by
Thompson Sherri P
Bought by
Sherri P Thompson T P and Sherri Thompson
Current Estimated Value
Home Financials for this Owner
Home Financials are based on the most recent Mortgage that was taken out on this home.
Original Mortgage
$338,575
Outstanding Balance
$240,003
Interest Rate
3.64%
Mortgage Type
New Conventional
Estimated Equity
$631,857
Purchase Details
Closed on
Jun 1, 2012
Sold by
Thompson Sherri P and Bjorkman
Bought by
Sherri P Thompson 2012 and Thompson
Purchase Details
Closed on
Jan 31, 2011
Sold by
Bjorkman Philip J
Bought by
Thompson Sherri
Purchase Details
Closed on
Aug 31, 2009
Sold by
Waltham Rt
Bought by
Bjorkman Wayne D and Mcanistan Kerryann
Purchase Details
Closed on
Dec 3, 2008
Sold by
Remis John M
Bought by
Waltham Rt
Create a Home Valuation Report for This Property
The Home Valuation Report is an in-depth analysis detailing your home's value as well as a comparison with similar homes in the area
Home Values in the Area
Average Home Value in this Area
Purchase History
| Date | Buyer | Sale Price | Title Company |
|---|---|---|---|
| Sherri P Thompson T P | -- | -- | |
| Sherri P Thompson T P | -- | -- | |
| Sherri P Thompson T | -- | -- | |
| Sherri P Thompson 2012 | -- | -- | |
| Sherri P Thompson 2012 | -- | -- | |
| Thompson Sherri | -- | -- | |
| Thompson Sherri | $365,000 | -- | |
| Thompson Sherri | $365,000 | -- | |
| Thompson Sherri | $365,000 | -- | |
| Bjorkman Wayne D | $369,900 | -- | |
| Bjorkman Wayne D | $369,900 | -- | |
| Waltham Rt | $170,000 | -- | |
| Waltham Rt | $170,000 | -- |
Source: Public Records
Mortgage History
| Date | Status | Borrower | Loan Amount |
|---|---|---|---|
| Open | Sherri P Thompson T | $338,575 | |
| Closed | Waltham Rt | $338,575 |
Source: Public Records
Tax History Compared to Growth
Tax History
| Year | Tax Paid | Tax Assessment Tax Assessment Total Assessment is a certain percentage of the fair market value that is determined by local assessors to be the total taxable value of land and additions on the property. | Land | Improvement |
|---|---|---|---|---|
| 2025 | $7,165 | $723,700 | $259,700 | $464,000 |
| 2024 | $6,971 | $670,900 | $249,700 | $421,200 |
| 2023 | $6,825 | $595,300 | $229,700 | $365,600 |
| 2022 | $6,825 | $527,000 | $199,700 | $327,300 |
| 2021 | $6,532 | $495,200 | $199,700 | $295,500 |
| 2020 | $6,364 | $477,400 | $189,800 | $287,600 |
| 2019 | $6,175 | $461,500 | $189,800 | $271,700 |
| 2018 | $6,099 | $456,200 | $189,800 | $266,400 |
| 2017 | $5,788 | $421,900 | $179,800 | $242,100 |
| 2016 | $5,633 | $405,800 | $179,800 | $226,000 |
| 2015 | $5,321 | $400,400 | $179,800 | $220,600 |
| 2014 | $5,227 | $393,300 | $179,800 | $213,500 |
Source: Public Records
Map
Nearby Homes