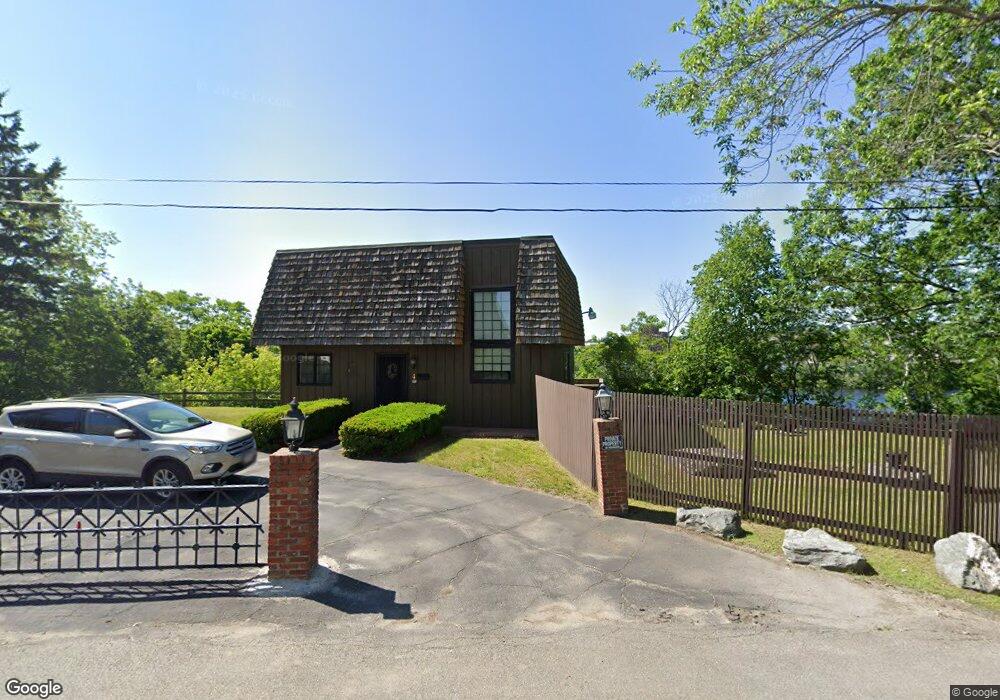
4 Penobscot St Brewer, ME 04412
Estimated Value: $279,000 - $334,164
2
Beds
2
Baths
1,800
Sq Ft
$170/Sq Ft
Est. Value
About This Home
This home is located at 4 Penobscot St, Brewer, ME 04412 and is currently estimated at $305,291, approximately $169 per square foot. 4 Penobscot St is a home with nearby schools including Brewer Community School, Brewer High School, and All Saints Catholic School St. Mary's campus PreK-3.
Ownership History
Date
Name
Owned For
Owner Type
Purchase Details
Closed on
Mar 29, 2023
Sold by
Mckenney Paul H
Bought by
Lydick Lynne M
Current Estimated Value
Home Financials for this Owner
Home Financials are based on the most recent Mortgage that was taken out on this home.
Original Mortgage
$206,900
Outstanding Balance
$201,202
Interest Rate
6.65%
Mortgage Type
Stand Alone Refi Refinance Of Original Loan
Estimated Equity
$104,089
Purchase Details
Closed on
Jan 24, 2023
Sold by
Mckenney Joyce M Est and Mckenney
Bought by
Mckenney Paul H and Lydick Lynne M
Create a Home Valuation Report for This Property
The Home Valuation Report is an in-depth analysis detailing your home's value as well as a comparison with similar homes in the area
Home Values in the Area
Average Home Value in this Area
Purchase History
| Date | Buyer | Sale Price | Title Company |
|---|---|---|---|
| Lydick Lynne M | -- | None Available | |
| Lydick Lynne M | -- | None Available | |
| Mckenney Paul H | -- | None Available | |
| Mckenney Paul H | -- | None Available |
Source: Public Records
Mortgage History
| Date | Status | Borrower | Loan Amount |
|---|---|---|---|
| Open | Lydick Lynne M | $206,900 | |
| Closed | Lydick Lynne M | $206,900 |
Source: Public Records
Tax History Compared to Growth
Tax History
| Year | Tax Paid | Tax Assessment Tax Assessment Total Assessment is a certain percentage of the fair market value that is determined by local assessors to be the total taxable value of land and additions on the property. | Land | Improvement |
|---|---|---|---|---|
| 2024 | $4,642 | $246,900 | $60,300 | $186,600 |
| 2023 | $4,476 | $222,700 | $56,700 | $166,000 |
| 2021 | $4,279 | $191,900 | $55,400 | $136,500 |
| 2020 | $4,332 | $190,400 | $55,400 | $135,000 |
| 2019 | $3,740 | $162,700 | $27,700 | $135,000 |
| 2018 | $4,003 | $177,900 | $27,700 | $150,200 |
| 2017 | $4,003 | $177,900 | $27,700 | $150,200 |
| 2016 | $3,828 | $177,900 | $27,700 | $150,200 |
| 2015 | $3,484 | $177,900 | $27,700 | $150,200 |
| 2014 | $3,722 | $177,900 | $27,700 | $150,200 |
| 2013 | $4,063 | $194,200 | $18,500 | $175,700 |
Source: Public Records
Map
Nearby Homes