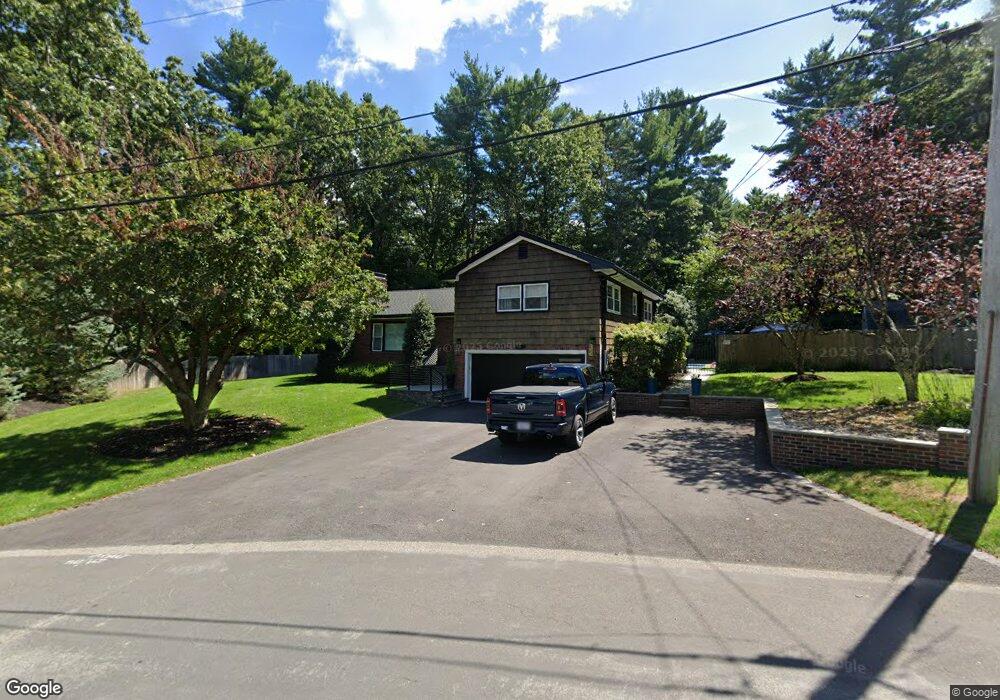
4 Peter Hobart Dr Hingham, MA 02043
South Hingham NeighborhoodEstimated Value: $1,016,000 - $1,314,000
About This Home
This home is located at 4 Peter Hobart Dr, Hingham, MA 02043 and is currently estimated at $1,168,175, approximately $561 per square foot. 4 Peter Hobart Dr is a home located in Plymouth County with nearby schools including South Elementary School, Hingham Middle School, and Hingham High School.
Ownership History
We collect this data history from publicly available records. To have your information removed, we recommend requesting removal directly through your county’s website.
Purchase Details
Home Financials for this Owner
Home Financials are based on the most recent Mortgage that was taken out on this home.Purchase Details
Purchase Details
Purchase Details
Home Values in the Area
Average Home Value in this Area
Purchase History
We collect this data history from publicly available records. To have your information removed, we recommend requesting removal directly through your county’s website.
| Date | Buyer | Sale Price | Title Company |
|---|---|---|---|
| $541,000 | -- | ||
| $541,000 | -- | ||
| $400,820 | -- | ||
| $400,820 | -- | ||
| $215,000 | -- | ||
| $215,000 | -- |
Mortgage History
We collect this data history from publicly available records. To have your information removed, we recommend requesting removal directly through your county’s website.
| Date | Status | Borrower | Loan Amount |
|---|---|---|---|
| Open | $147,000 | ||
| Closed | $147,000 | ||
| Previous Owner | $73,373 |
Tax History
We collect this data history from publicly available records. To have your information removed, we recommend requesting removal directly through your county’s website.
| Year | Tax Paid | Tax Assessment Tax Assessment Total Assessment is a certain percentage of the fair market value that is determined by local assessors to be the total taxable value of land and additions on the property. | Land | Improvement |
|---|---|---|---|---|
| 2025 | $9,402 | $879,500 | $471,000 | $408,500 |
| 2024 | $8,524 | $785,600 | $471,000 | $314,600 |
| 2023 | $7,538 | $753,800 | $471,000 | $282,800 |
| 2022 | $7,136 | $617,300 | $363,600 | $253,700 |
| 2021 | $6,995 | $592,800 | $363,600 | $229,200 |
| 2020 | $6,835 | $592,800 | $363,600 | $229,200 |
| 2019 | $6,868 | $581,500 | $363,600 | $217,900 |
| 2018 | $6,452 | $548,200 | $363,600 | $184,600 |
| 2017 | $6,689 | $546,000 | $371,800 | $174,200 |
| 2016 | $6,810 | $545,200 | $354,100 | $191,100 |
| 2015 | $6,799 | $542,600 | $337,000 | $205,600 |
Map
- 130 Whiting St
- 153 Whiting St
- 150 Whiting St
- 151 Whiting St
- 155 Whiting St
- 140 Whiting St
- 3 Peter Hobart Dr
- 24 Hazelwood Dr
- 131 Whiting St
- 167 Whiting St
- 6 Peter Hobart Dr
- 22 Hazelwood Dr
- 5 Peter Hobart Dr
- 125 Whiting St
- 12 Peter Hobart Dr
- 15 Hazelwood Dr
- 20 Hazelwood Dr
- 123 Whiting St
- 13 Hazelwood Dr
- 14 Peter Hobart Dr
Ask me questions while you tour the home.