Estimated Value: $872,819 - $1,145,000
4
Beds
3
Baths
2,260
Sq Ft
$429/Sq Ft
Est. Value
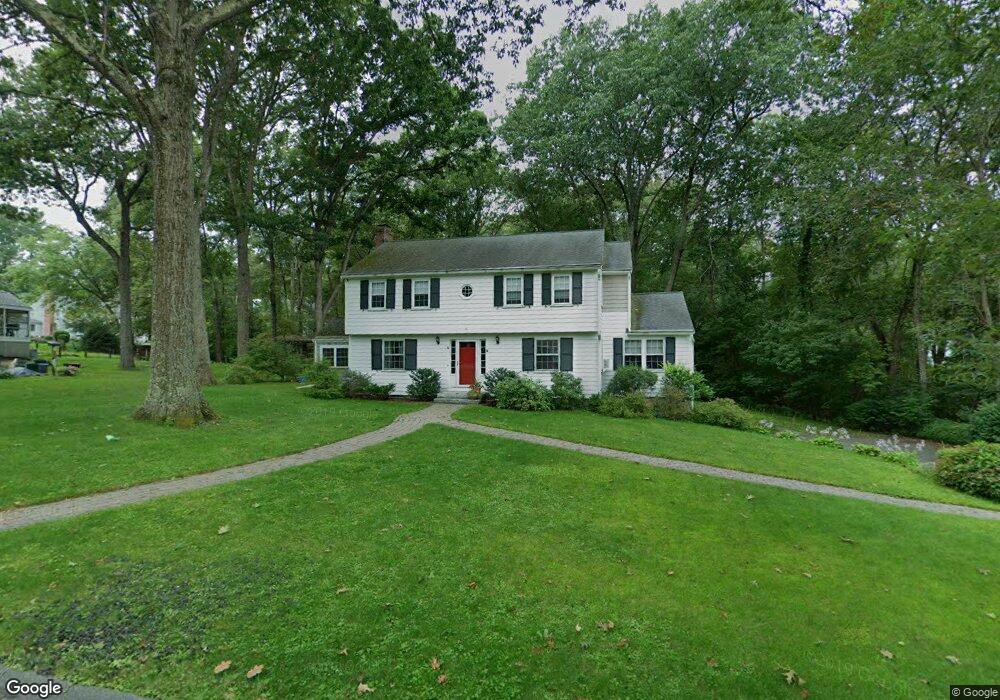
About This Home
This home is located at 4 Phalen St, Acton, MA 01720 and is currently estimated at $970,205, approximately $429 per square foot. 4 Phalen St is a home located in Middlesex County with nearby schools including Acton-Boxborough Regional High School and Concord Academy.
Ownership History
Date
Name
Owned For
Owner Type
Purchase Details
Closed on
May 5, 2022
Sold by
Ahern William F and Ahern Barbara R
Bought by
4 Phalem Street Rt
Current Estimated Value
Purchase Details
Closed on
Oct 15, 1993
Sold by
Gordinier Harold R
Bought by
Ahern William F and Ahern Barbara R
Home Financials for this Owner
Home Financials are based on the most recent Mortgage that was taken out on this home.
Original Mortgage
$208,000
Interest Rate
6.87%
Mortgage Type
Purchase Money Mortgage
Create a Home Valuation Report for This Property
The Home Valuation Report is an in-depth analysis detailing your home's value as well as a comparison with similar homes in the area
Home Values in the Area
Average Home Value in this Area
Purchase History
| Date | Buyer | Sale Price | Title Company |
|---|---|---|---|
| 4 Phalem Street Rt | -- | None Available | |
| Ahern William F | $260,000 | -- |
Source: Public Records
Mortgage History
| Date | Status | Borrower | Loan Amount |
|---|---|---|---|
| Previous Owner | Ahern William F | $190,000 | |
| Previous Owner | Ahern William F | $208,000 | |
| Previous Owner | Ahern William F | $80,000 |
Source: Public Records
Tax History
| Year | Tax Paid | Tax Assessment Tax Assessment Total Assessment is a certain percentage of the fair market value that is determined by local assessors to be the total taxable value of land and additions on the property. | Land | Improvement |
|---|---|---|---|---|
| 2025 | $14,070 | $820,400 | $362,400 | $458,000 |
| 2024 | $13,189 | $791,200 | $362,400 | $428,800 |
| 2023 | $12,857 | $732,200 | $330,300 | $401,900 |
| 2022 | $12,174 | $625,900 | $286,800 | $339,100 |
| 2021 | $11,869 | $586,700 | $265,500 | $321,200 |
| 2020 | $11,202 | $582,200 | $265,500 | $316,700 |
| 2019 | $10,793 | $557,200 | $265,500 | $291,700 |
| 2018 | $10,620 | $548,000 | $265,500 | $282,500 |
| 2017 | $10,357 | $543,400 | $265,500 | $277,900 |
| 2016 | $10,186 | $529,700 | $265,500 | $264,200 |
| 2015 | $9,986 | $524,200 | $265,500 | $258,700 |
| 2014 | $9,707 | $499,100 | $265,500 | $233,600 |
Source: Public Records
Map
Nearby Homes
Your Personal Tour Guide
Ask me questions while you tour the home.