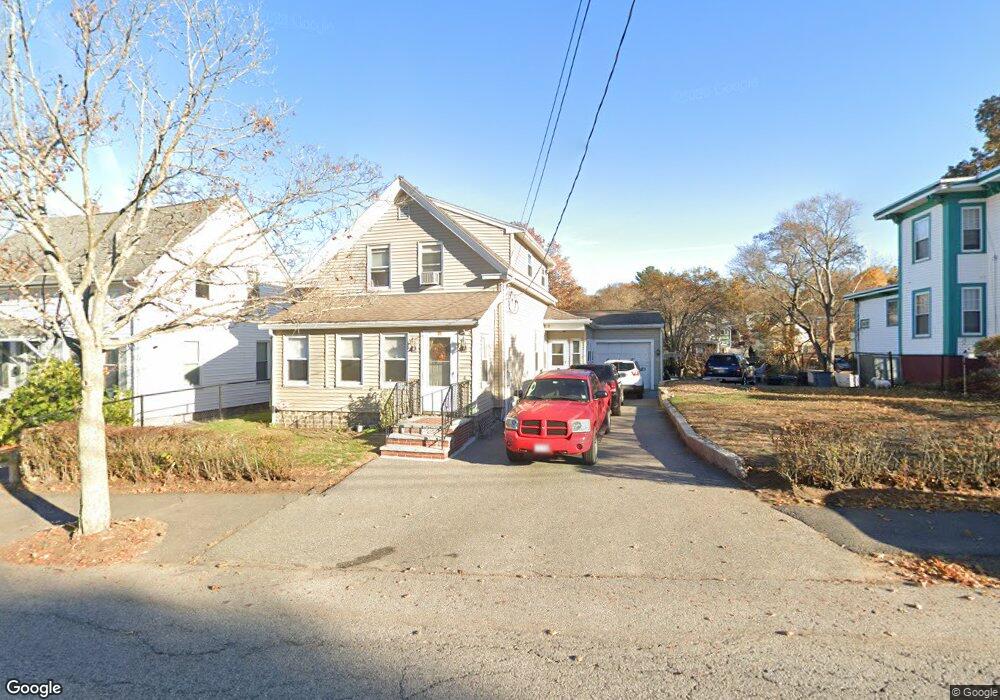
4 Pond St Stoneham, MA 02180
Haywardville NeighborhoodEstimated Value: $733,000 - $774,548
2
Beds
2
Baths
2,053
Sq Ft
$365/Sq Ft
Est. Value
About This Home
This home is located at 4 Pond St, Stoneham, MA 02180 and is currently estimated at $749,137, approximately $364 per square foot. 4 Pond St is a home located in Middlesex County with nearby schools including Stoneham High School, St. Patrick Elementary School, and Greater Boston Academy.
Ownership History
Date
Name
Owned For
Owner Type
Purchase Details
Closed on
Jul 30, 2008
Sold by
Martiniello Annmarie G
Bought by
Martiniello Annmaire G and Martiniello Giovanni G
Current Estimated Value
Home Financials for this Owner
Home Financials are based on the most recent Mortgage that was taken out on this home.
Original Mortgage
$93,500
Outstanding Balance
$61,787
Interest Rate
6.47%
Mortgage Type
Purchase Money Mortgage
Estimated Equity
$687,350
Purchase Details
Closed on
Feb 22, 2008
Sold by
Minghella Frank T Est and Minghella Frank T
Bought by
Martiniello Annmarie G
Create a Home Valuation Report for This Property
The Home Valuation Report is an in-depth analysis detailing your home's value as well as a comparison with similar homes in the area
Home Values in the Area
Average Home Value in this Area
Purchase History
| Date | Buyer | Sale Price | Title Company |
|---|---|---|---|
| Martiniello Annmaire G | -- | -- | |
| Martiniello Annmarie G | -- | -- |
Source: Public Records
Mortgage History
| Date | Status | Borrower | Loan Amount |
|---|---|---|---|
| Open | Martiniello Annmaire G | $93,500 |
Source: Public Records
Tax History Compared to Growth
Tax History
| Year | Tax Paid | Tax Assessment Tax Assessment Total Assessment is a certain percentage of the fair market value that is determined by local assessors to be the total taxable value of land and additions on the property. | Land | Improvement |
|---|---|---|---|---|
| 2025 | $7,089 | $693,000 | $360,200 | $332,800 |
| 2024 | $6,781 | $640,300 | $331,800 | $308,500 |
| 2023 | $6,591 | $593,800 | $303,300 | $290,500 |
| 2022 | $5,698 | $547,400 | $274,900 | $272,500 |
| 2021 | $5,464 | $505,000 | $237,000 | $268,000 |
| 2020 | $5,236 | $485,300 | $225,000 | $260,300 |
| 2019 | $5,115 | $455,900 | $210,800 | $245,100 |
| 2018 | $5,382 | $435,800 | $206,200 | $229,600 |
| 2017 | $5,305 | $428,200 | $183,300 | $244,900 |
| 2016 | $4,666 | $367,400 | $183,300 | $184,100 |
| 2015 | $4,397 | $339,300 | $165,000 | $174,300 |
| 2014 | $4,676 | $346,600 | $146,700 | $199,900 |
Source: Public Records
Map
Nearby Homes
- 8 Walnut St
- 27 Emerson St Unit 27
- 17 Emerson St Unit A
- 17A 17 B Emerson
- 137 Franklin St Unit 102
- 137 Franklin St Unit 404
- 34 Warren St Unit 3
- 17 Franklin St
- 159 Franklin St Unit C2
- 43 Pomeworth St Unit 44
- 11 Congress St
- 10 Pomeworth St Unit H
- 25 Murdoch Rd
- 20 Myrtle St
- 13 Washington Ave
- 4 Gavin Cir
- 6 Gavin Cir
- 12 Cottage St
- 588 Main St Unit 3C
- 39 Tamarock Terrace