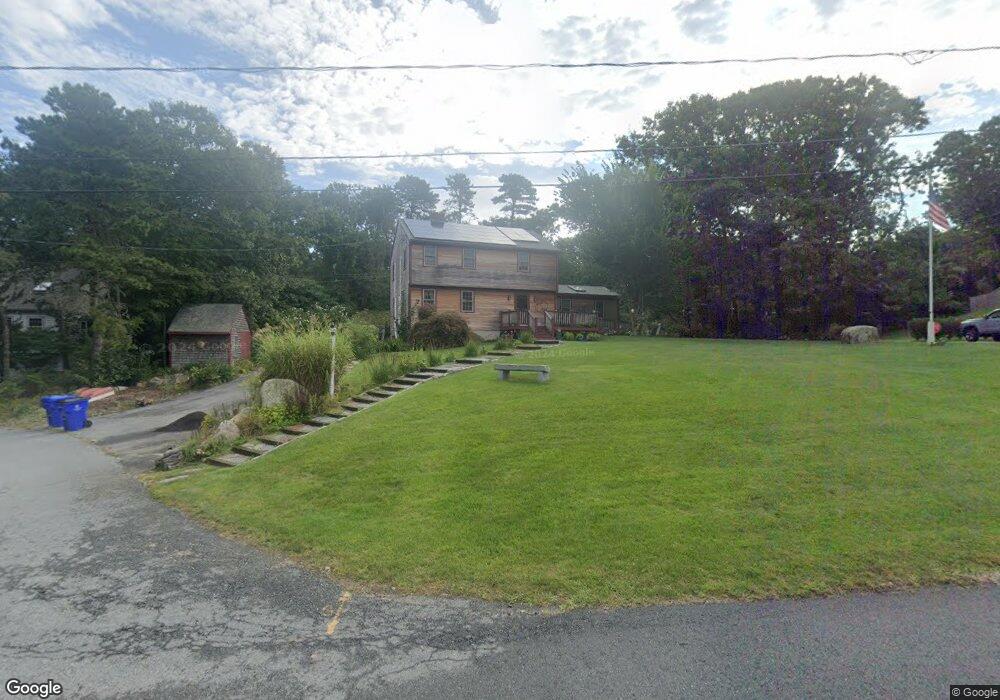
4 Puffin Cir Cataumet, MA 2534
Cataumet NeighborhoodEstimated Value: $725,148 - $926,000
3
Beds
3
Baths
2,140
Sq Ft
$378/Sq Ft
Est. Value
About This Home
This home is located at 4 Puffin Cir, Cataumet, MA 2534 and is currently estimated at $809,287, approximately $378 per square foot. 4 Puffin Cir is a home located in Barnstable County with nearby schools including Bourne High School, Cadence Academy Preschool - Bourne, and Heritage Christian Academy.
Ownership History
Date
Name
Owned For
Owner Type
Purchase Details
Closed on
Feb 7, 2020
Sold by
Kraupse John and Duffy Patricia J
Bought by
John Krauspe T and John Krauspe
Current Estimated Value
Purchase Details
Closed on
Sep 14, 1998
Sold by
Noonan John E
Bought by
Kraupse John and Duffy Patricia J
Create a Home Valuation Report for This Property
The Home Valuation Report is an in-depth analysis detailing your home's value as well as a comparison with similar homes in the area
Home Values in the Area
Average Home Value in this Area
Purchase History
| Date | Buyer | Sale Price | Title Company |
|---|---|---|---|
| John Krauspe T | -- | None Available | |
| John Krauspe T | -- | None Available | |
| Kraupse John | $185,000 | -- | |
| Kraupse John | $185,000 | -- |
Source: Public Records
Mortgage History
| Date | Status | Borrower | Loan Amount |
|---|---|---|---|
| Previous Owner | Kraupse John | $150,000 | |
| Previous Owner | Kraupse John | $108,000 |
Source: Public Records
Tax History Compared to Growth
Tax History
| Year | Tax Paid | Tax Assessment Tax Assessment Total Assessment is a certain percentage of the fair market value that is determined by local assessors to be the total taxable value of land and additions on the property. | Land | Improvement |
|---|---|---|---|---|
| 2025 | $4,802 | $614,900 | $247,100 | $367,800 |
| 2024 | $4,700 | $586,000 | $235,300 | $350,700 |
| 2023 | $4,570 | $518,700 | $208,300 | $310,400 |
| 2022 | $4,719 | $467,700 | $221,200 | $246,500 |
| 2021 | $4,586 | $425,800 | $201,300 | $224,500 |
| 2020 | $4,460 | $415,300 | $199,400 | $215,900 |
| 2019 | $4,292 | $408,400 | $199,400 | $209,000 |
| 2018 | $4,100 | $389,000 | $189,900 | $199,100 |
| 2017 | $4,032 | $391,500 | $194,400 | $197,100 |
| 2016 | $3,811 | $375,100 | $194,400 | $180,700 |
| 2015 | $3,650 | $362,500 | $181,800 | $180,700 |
Source: Public Records
Map
Nearby Homes