Estimated Value: $2,812,000 - $3,439,000
3
Beds
1
Bath
2,291
Sq Ft
$1,363/Sq Ft
Est. Value
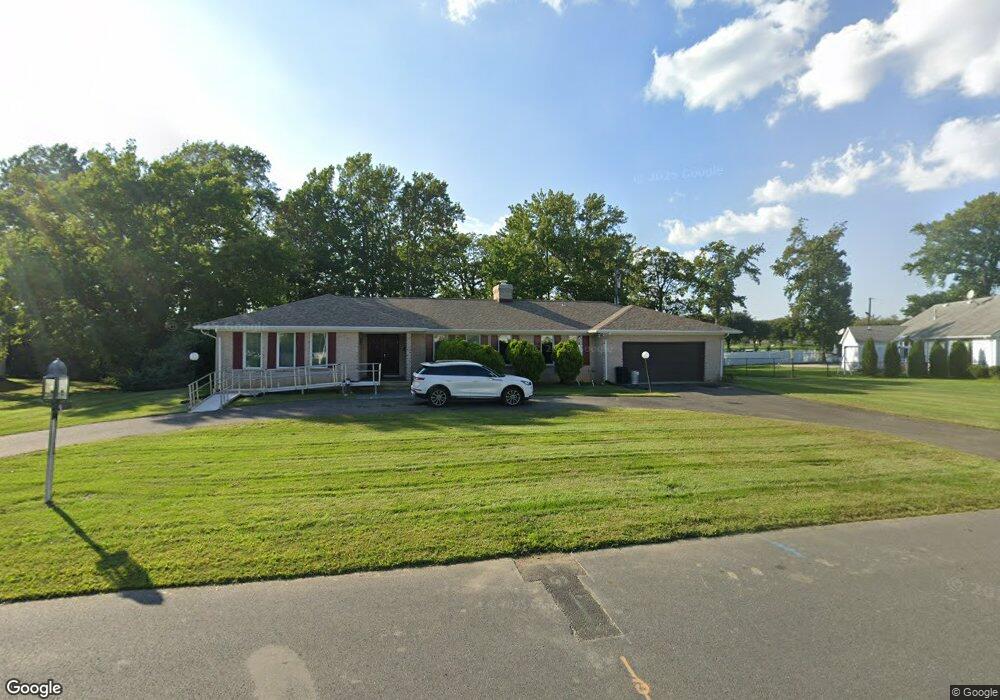
About This Home
This home is located at 4 Queen Ann Dr, Deal, NJ 07723 and is currently estimated at $3,122,792, approximately $1,363 per square foot. 4 Queen Ann Dr is a home located in Monmouth County with nearby schools including Deal Elementary School, Hope Academy Charter School, and St. Mary of the Assumption School.
Ownership History
Date
Name
Owned For
Owner Type
Purchase Details
Closed on
Jul 1, 2025
Sold by
Levy Family 2015 Revocable Trust and Massry Lynda Levy
Bought by
Massry Lynda Levy
Current Estimated Value
Purchase Details
Closed on
Sep 30, 2015
Sold by
Levy Janet
Bought by
Levy Albert and Levy Janet
Purchase Details
Closed on
Jul 30, 2015
Sold by
Levy Albert and Levy Janet
Bought by
Levy Albert and Levy Janet
Create a Home Valuation Report for This Property
The Home Valuation Report is an in-depth analysis detailing your home's value as well as a comparison with similar homes in the area
Home Values in the Area
Average Home Value in this Area
Purchase History
| Date | Buyer | Sale Price | Title Company |
|---|---|---|---|
| Massry Lynda Levy | -- | None Listed On Document | |
| Massry Lynda Levy | -- | None Listed On Document | |
| Levy Albert | -- | Attorney | |
| Levy Albert | -- | Attorney |
Source: Public Records
Tax History Compared to Growth
Tax History
| Year | Tax Paid | Tax Assessment Tax Assessment Total Assessment is a certain percentage of the fair market value that is determined by local assessors to be the total taxable value of land and additions on the property. | Land | Improvement |
|---|---|---|---|---|
| 2025 | $12,351 | $3,321,500 | $3,030,400 | $291,100 |
| 2024 | $10,904 | $2,892,600 | $2,631,500 | $261,100 |
| 2023 | $10,904 | $2,370,400 | $2,143,100 | $227,300 |
| 2022 | $9,061 | $1,696,200 | $1,536,600 | $159,600 |
| 2021 | $7,211 | $1,394,000 | $1,236,900 | $157,100 |
| 2020 | $7,544 | $1,056,600 | $660,200 | $396,400 |
| 2019 | $7,211 | $1,017,000 | $622,900 | $394,100 |
| 2018 | $6,867 | $989,500 | $622,900 | $366,600 |
| 2017 | $7,362 | $1,056,200 | $701,100 | $355,100 |
| 2016 | $6,911 | $988,700 | $655,200 | $333,500 |
| 2015 | $6,961 | $973,600 | $655,200 | $318,400 |
| 2014 | $5,410 | $757,700 | $548,000 | $209,700 |
Source: Public Records
Map
Nearby Homes