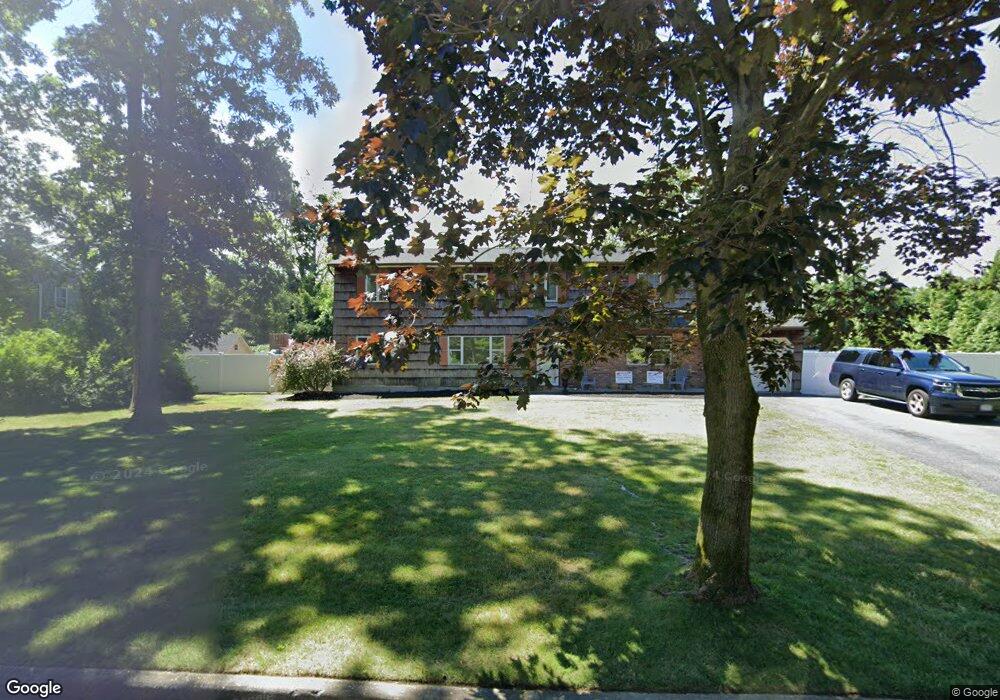
4 Regency Ct Nesconset, NY 11767
Estimated Value: $740,000 - $932,000
5
Beds
3
Baths
2,550
Sq Ft
$333/Sq Ft
Est. Value
About This Home
This home is located at 4 Regency Ct, Nesconset, NY 11767 and is currently estimated at $850,216, approximately $333 per square foot. 4 Regency Ct is a home located in Suffolk County with nearby schools including Tackan Elementary School and St Patrick Elementary School.
Ownership History
Date
Name
Owned For
Owner Type
Purchase Details
Closed on
Dec 4, 2017
Sold by
Sexton Jonathan and Sexton Amanda
Bought by
Ritto Brian and Ritto Jenna
Current Estimated Value
Home Financials for this Owner
Home Financials are based on the most recent Mortgage that was taken out on this home.
Original Mortgage
$322,500
Outstanding Balance
$268,511
Interest Rate
3.94%
Mortgage Type
Purchase Money Mortgage
Estimated Equity
$581,705
Purchase Details
Closed on
Dec 5, 2014
Sold by
Dennihy Deborah and Haupert Deborah
Bought by
Sexton Jonathan and Sexton Amanda
Home Financials for this Owner
Home Financials are based on the most recent Mortgage that was taken out on this home.
Original Mortgage
$439,200
Interest Rate
3.99%
Mortgage Type
New Conventional
Purchase Details
Closed on
Jul 27, 1998
Sold by
Dennihy Peter and Dennihy Deborah
Bought by
Dennihy Deborah
Create a Home Valuation Report for This Property
The Home Valuation Report is an in-depth analysis detailing your home's value as well as a comparison with similar homes in the area
Home Values in the Area
Average Home Value in this Area
Purchase History
| Date | Buyer | Sale Price | Title Company |
|---|---|---|---|
| Ritto Brian | $430,000 | -- | |
| Sexton Jonathan | $430,000 | Chace Abstract Llc | |
| Dennihy Deborah | -- | Chicago Title Insurance Co |
Source: Public Records
Mortgage History
| Date | Status | Borrower | Loan Amount |
|---|---|---|---|
| Open | Ritto Brian | $322,500 | |
| Previous Owner | Sexton Jonathan | $439,200 |
Source: Public Records
Tax History
| Year | Tax Paid | Tax Assessment Tax Assessment Total Assessment is a certain percentage of the fair market value that is determined by local assessors to be the total taxable value of land and additions on the property. | Land | Improvement |
|---|---|---|---|---|
| 2024 | $15,349 | $5,909 | $500 | $5,409 |
| 2023 | $15,349 | $5,909 | $500 | $5,409 |
| 2022 | $11,278 | $5,909 | $500 | $5,409 |
| 2021 | $11,278 | $5,909 | $500 | $5,409 |
| 2020 | $13,141 | $5,289 | $500 | $4,789 |
| 2019 | $13,141 | $0 | $0 | $0 |
| 2018 | $0 | $5,390 | $500 | $4,890 |
| 2017 | $11,069 | $5,390 | $500 | $4,890 |
| 2016 | $10,944 | $5,390 | $500 | $4,890 |
| 2015 | -- | $5,390 | $500 | $4,890 |
| 2014 | -- | $5,390 | $500 | $4,890 |
Source: Public Records
Map
Nearby Homes
- 12 Crystal Brook Ct
- 1 Garfield Ct
- 93 Gibbs Pond Rd
- 7 Sara Ct
- 4 Chelsea Dr
- 67 Paddington Cir
- Lot 1 Sycamore Estates
- Lot 3 Sycamore Estates
- 55 Tiffany Way Unit 16
- 18 Canterbury Ln
- 48 Roy Dr
- 18 Annetta Ave
- 105 Browns Rd
- 200 Southern Blvd
- 42 Maple Glen Ln
- 0 Middle Country Rd
- 18 Lloyd Ln
- 148 S Hillside Ave
- 10 Smithtown Blvd Unit 6A
- 10 Smithtown Blvd Unit 7B
Your Personal Tour Guide
Ask me questions while you tour the home.