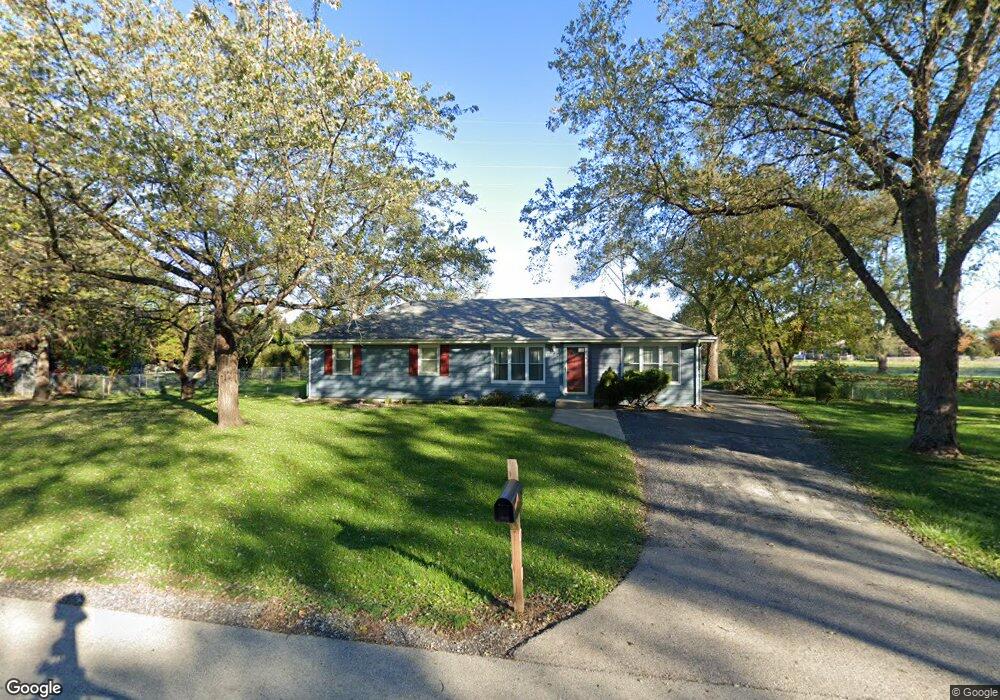
4 Robert Ave Prospect Heights, IL 60070
Estimated Value: $391,000 - $450,000
3
Beds
1
Bath
1,379
Sq Ft
$300/Sq Ft
Est. Value
About This Home
This home is located at 4 Robert Ave, Prospect Heights, IL 60070 and is currently estimated at $413,990, approximately $300 per square foot. 4 Robert Ave is a home located in Cook County with nearby schools including Dwight D Eisenhower Elementary School, Anne Sullivan Elementary School, and Betsy Ross Elementary School.
Ownership History
Date
Name
Owned For
Owner Type
Purchase Details
Closed on
Dec 12, 2006
Sold by
Woodward Maria B and Woodward Maria E
Bought by
Woodward Maria B
Current Estimated Value
Home Financials for this Owner
Home Financials are based on the most recent Mortgage that was taken out on this home.
Original Mortgage
$181,500
Outstanding Balance
$108,093
Interest Rate
6.24%
Mortgage Type
New Conventional
Estimated Equity
$305,897
Purchase Details
Closed on
May 22, 1999
Sold by
Woodward Oliver H and Woodward Maria E
Bought by
Woodward Oliver H and Woodward Maria E
Purchase Details
Closed on
Jun 12, 1996
Sold by
Kehl Patricia R and Stearns Charles K
Bought by
Woodward Oliver H and Woodward Maria
Home Financials for this Owner
Home Financials are based on the most recent Mortgage that was taken out on this home.
Original Mortgage
$123,200
Interest Rate
7.95%
Create a Home Valuation Report for This Property
The Home Valuation Report is an in-depth analysis detailing your home's value as well as a comparison with similar homes in the area
Home Values in the Area
Average Home Value in this Area
Purchase History
| Date | Buyer | Sale Price | Title Company |
|---|---|---|---|
| Woodward Maria B | -- | None Available | |
| Woodward Oliver H | -- | -- | |
| Woodward Oliver H | $154,000 | -- |
Source: Public Records
Mortgage History
| Date | Status | Borrower | Loan Amount |
|---|---|---|---|
| Open | Woodward Maria B | $181,500 | |
| Closed | Woodward Oliver H | $123,200 |
Source: Public Records
Tax History Compared to Growth
Tax History
| Year | Tax Paid | Tax Assessment Tax Assessment Total Assessment is a certain percentage of the fair market value that is determined by local assessors to be the total taxable value of land and additions on the property. | Land | Improvement |
|---|---|---|---|---|
| 2024 | $2,845 | $28,000 | $5,010 | $22,990 |
| 2023 | $2,752 | $28,000 | $5,010 | $22,990 |
| 2022 | $2,752 | $28,000 | $5,010 | $22,990 |
| 2021 | $3,118 | $22,507 | $7,014 | $15,493 |
| 2020 | $2,812 | $22,507 | $7,014 | $15,493 |
| 2019 | $2,775 | $24,980 | $7,014 | $17,966 |
| 2018 | $6,996 | $29,502 | $6,012 | $23,490 |
| 2017 | $2,945 | $29,502 | $6,012 | $23,490 |
| 2016 | $3,507 | $29,502 | $6,012 | $23,490 |
| 2015 | $4,068 | $27,276 | $5,010 | $22,266 |
| 2014 | $3,941 | $27,276 | $5,010 | $22,266 |
| 2013 | $3,935 | $27,276 | $5,010 | $22,266 |
Source: Public Records
Map
Nearby Homes
- 1500 Sandstone Dr Unit 307
- 1430 Sandstone Dr Unit 202
- 1525 Sander Ct Unit 103
- 11 W Palatine Rd
- 1450 Sandpebble Dr Unit 333
- 1450 Sandpebble Dr Unit 227
- 1201 Pleasant Run Dr Unit 312
- 1550 Sandpebble Dr Unit 209
- 1376 Longacre Ln Unit 113
- 1425 Sandpebble Dr Unit 227
- 1425 Sandpebble Dr Unit 340
- 1575 Sandpebble Dr Unit 226
- 1321 Longacre Ln Unit 45
- 1088 Pear Tree Ln
- 1014 N Elmhurst Rd
- 307 Anne Ct
- 1094 Shady Tree Ln
- 13 W Kenilworth Ave
- 21 E Stonegate Dr
- 505 N Maple St
- 2 Robert Ave
- 6 Robert Ave
- 814 N Maple St
- 815 N Elmhurst Rd
- 795 Equestrian Dr
- 785 Equestrian Dr Unit 2
- 838 N Elmhurst Rd
- 816 N Elmhurst Rd
- 8 Robert Ave
- 775 Equestrian Dr
- 765 Equestrian Dr
- 813 N Elmhurst Rd
- 815 N Maple St
- 755 Equestrian Dr
- 900 N Elmhurst Rd
- 2 Andover Dr
- 735 W Paddock Dr
- 725 W Paddock Dr
- 10 Robert Ave
- 813 N Maple St