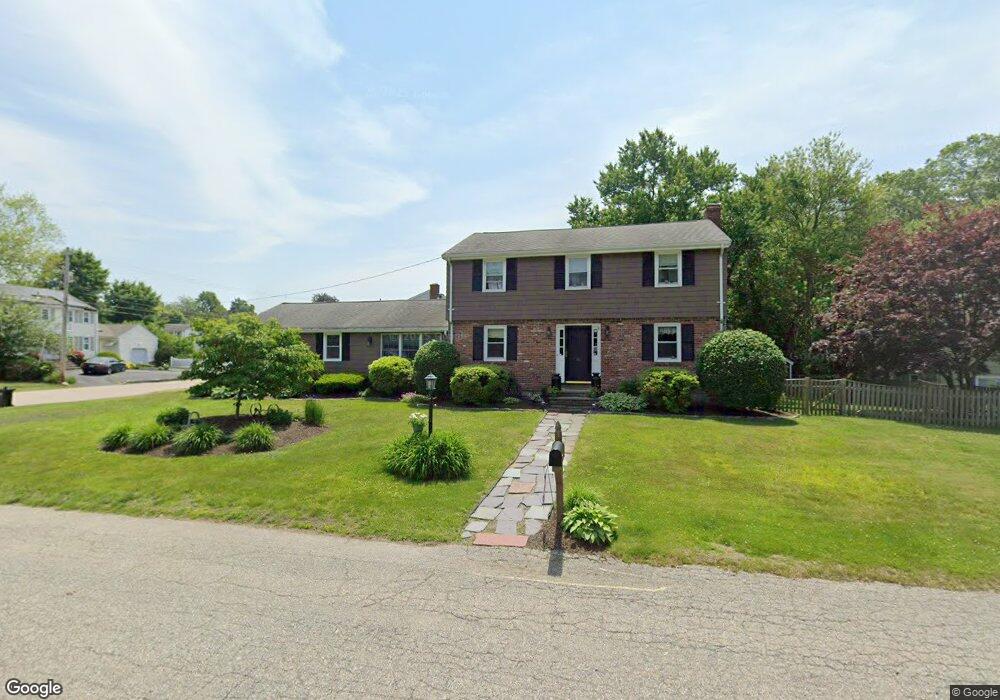
4 Roch Cir Brockton, MA 02301
Estimated Value: $601,000 - $641,000
4
Beds
2
Baths
1,832
Sq Ft
$339/Sq Ft
Est. Value
About This Home
This home is located at 4 Roch Cir, Brockton, MA 02301 and is currently estimated at $621,281, approximately $339 per square foot. 4 Roch Cir is a home located in Plymouth County with nearby schools including Hancock Elementary School, Manthala George Jr. School, and Louis F Angelo Elementary School.
Ownership History
Date
Name
Owned For
Owner Type
Purchase Details
Closed on
May 19, 2005
Sold by
Pigeon Mark D and Dalton Lorraine C
Bought by
Liolios Daniel P and Liolios Geraldine A
Current Estimated Value
Purchase Details
Closed on
Jul 16, 1993
Sold by
Pitts John J and Pitts Grace L
Bought by
Pigeon Mark D and Dalton Lorraine C
Create a Home Valuation Report for This Property
The Home Valuation Report is an in-depth analysis detailing your home's value as well as a comparison with similar homes in the area
Home Values in the Area
Average Home Value in this Area
Purchase History
| Date | Buyer | Sale Price | Title Company |
|---|---|---|---|
| Liolios Daniel P | $415,000 | -- | |
| Pigeon Mark D | $135,000 | -- |
Source: Public Records
Mortgage History
| Date | Status | Borrower | Loan Amount |
|---|---|---|---|
| Open | Pigeon Mark D | $196,000 | |
| Closed | Pigeon Mark D | $207,000 |
Source: Public Records
Tax History Compared to Growth
Tax History
| Year | Tax Paid | Tax Assessment Tax Assessment Total Assessment is a certain percentage of the fair market value that is determined by local assessors to be the total taxable value of land and additions on the property. | Land | Improvement |
|---|---|---|---|---|
| 2025 | $6,073 | $501,500 | $152,000 | $349,500 |
| 2024 | $6,003 | $499,400 | $152,000 | $347,400 |
| 2023 | $6,063 | $467,100 | $117,400 | $349,700 |
| 2022 | $5,504 | $394,000 | $107,000 | $287,000 |
| 2021 | $5,365 | $370,000 | $99,400 | $270,600 |
| 2020 | $5,421 | $357,800 | $95,200 | $262,600 |
| 2019 | $4,852 | $312,200 | $89,100 | $223,100 |
| 2018 | $4,953 | $308,400 | $89,100 | $219,300 |
| 2017 | $4,529 | $281,300 | $89,100 | $192,200 |
| 2016 | $4,569 | $263,200 | $85,300 | $177,900 |
| 2015 | $4,323 | $238,200 | $85,300 | $152,900 |
| 2014 | $4,600 | $253,700 | $85,300 | $168,400 |
Source: Public Records
Map
Nearby Homes