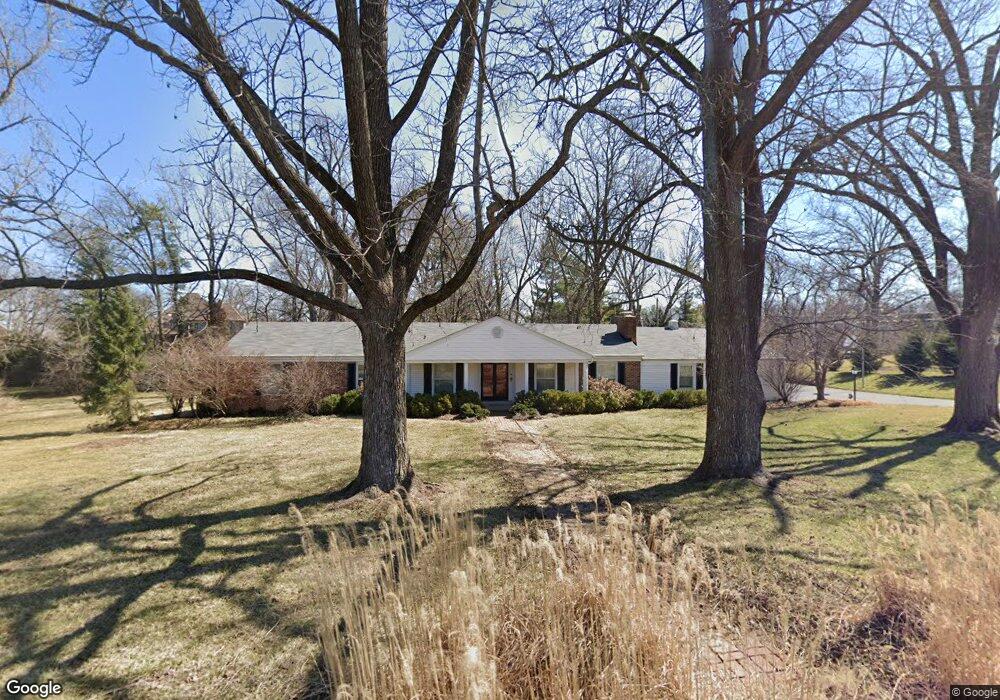
4 Roclare Ln Saint Louis, MO 63131
Estimated Value: $951,793 - $1,198,000
4
Beds
4
Baths
3,209
Sq Ft
$327/Sq Ft
Est. Value
About This Home
This home is located at 4 Roclare Ln, Saint Louis, MO 63131 and is currently estimated at $1,049,698, approximately $327 per square foot. 4 Roclare Ln is a home located in St. Louis County with nearby schools including Mason Ridge Elementary School, Parkway West Middle School, and Parkway West High School.
Ownership History
Date
Name
Owned For
Owner Type
Purchase Details
Closed on
Jun 19, 2003
Sold by
Piraino Russell W and Piraino Julia E
Bought by
Newberry Rodney D and Newberry Elizabeth P
Current Estimated Value
Home Financials for this Owner
Home Financials are based on the most recent Mortgage that was taken out on this home.
Original Mortgage
$322,700
Outstanding Balance
$137,866
Interest Rate
5.44%
Mortgage Type
Purchase Money Mortgage
Estimated Equity
$911,832
Purchase Details
Closed on
Jun 8, 2001
Sold by
March Rebecca W
Bought by
Piraino Russell W and Piraino Julia E
Home Financials for this Owner
Home Financials are based on the most recent Mortgage that was taken out on this home.
Original Mortgage
$380,000
Interest Rate
7.1%
Purchase Details
Closed on
Feb 1, 2001
Sold by
Courtney Matheu E
Bought by
March Rebecca W and Rebecca W March Revocable Trust
Create a Home Valuation Report for This Property
The Home Valuation Report is an in-depth analysis detailing your home's value as well as a comparison with similar homes in the area
Home Values in the Area
Average Home Value in this Area
Purchase History
| Date | Buyer | Sale Price | Title Company |
|---|---|---|---|
| Newberry Rodney D | $545,000 | -- | |
| Piraino Russell W | $475,000 | -- | |
| Piraino Russell W | -- | -- | |
| March Rebecca W | -- | -- |
Source: Public Records
Mortgage History
| Date | Status | Borrower | Loan Amount |
|---|---|---|---|
| Open | Newberry Rodney D | $322,700 | |
| Previous Owner | Piraino Russell W | $380,000 | |
| Closed | Piraino Russell W | $47,500 | |
| Closed | Newberry Rodney D | $113,300 |
Source: Public Records
Tax History Compared to Growth
Tax History
| Year | Tax Paid | Tax Assessment Tax Assessment Total Assessment is a certain percentage of the fair market value that is determined by local assessors to be the total taxable value of land and additions on the property. | Land | Improvement |
|---|---|---|---|---|
| 2025 | $7,591 | $163,230 | $85,500 | $77,730 |
| 2024 | $7,591 | $130,490 | $76,000 | $54,490 |
| 2023 | $7,184 | $130,490 | $76,000 | $54,490 |
| 2022 | $6,697 | $110,540 | $85,500 | $25,040 |
| 2021 | $6,641 | $110,540 | $85,500 | $25,040 |
| 2020 | $6,342 | $100,930 | $85,500 | $15,430 |
| 2019 | $6,253 | $100,930 | $85,500 | $15,430 |
| 2018 | $6,870 | $102,510 | $76,000 | $26,510 |
| 2017 | $6,776 | $102,510 | $76,000 | $26,510 |
| 2016 | $5,803 | $83,450 | $66,500 | $16,950 |
| 2015 | $6,117 | $83,450 | $66,500 | $16,950 |
| 2014 | $5,366 | $79,530 | $25,040 | $54,490 |
Source: Public Records
Map
Nearby Homes
- 11 Roclare Ln
- 29a Chapel Hill Estates Dr
- 12549 Bickford Dr
- 1515 Topping Rd
- 1652 Mason Knoll Rd
- 9 Kirken Knoll Dr
- 13527 Royal Glen Dr
- Pearson Plan at Deer Hollow - Masterpiece Collection
- Clay Plan at Deer Hollow - Masterpiece Collection
- Rhodes Plan at Deer Hollow - Masterpiece Collection
- Huxley Plan at Deer Hollow - Masterpiece Collection
- Teagan Plan at Deer Hollow - Masterpiece Collection
- Finley Plan at Deer Hollow - Masterpiece Collection
- Margot Plan at Deer Hollow - Masterpiece Collection
- Everett Plan at Deer Hollow - Masterpiece Collection
- Mitchell Plan at Deer Hollow - Masterpiece Collection
- Grayson Plan at Deer Hollow - Masterpiece Collection
- 0 Unknown Unit 22071090
- 2409 N Ballas Rd
- 1359 S Mason Rd
- 6 Roclare Ln
- 2 Roclare Ln
- 3 Roclare Ln
- 1015 Claymark Dr
- 5 Roclare Ln
- 1 Roclare Ln
- 1021 Claymark Dr
- 1027 Claymark Dr
- 1007 Claymark Dr
- 1033 Claymark Dr
- 8 Roclare Ln
- 2 Vandiver Ln
- 2 Vandiver Ln
- 10 Vandiver Ln
- 7 Roclare Ln
- 1100 Westmoor Place
- 0Lot 3 Vandiver Ln
- 1022 Claymark Dr
- 1001 Claymark Dr
- 1101 Westmoor Place