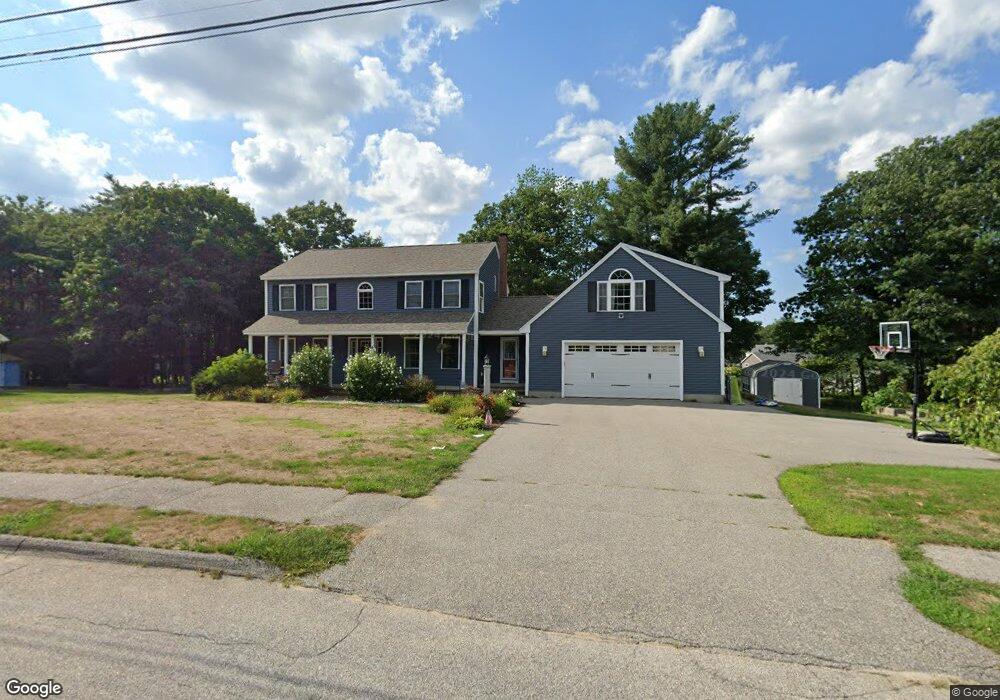
4 Romeo Ln Biddeford, ME 04005
South Biddeford NeighborhoodEstimated Value: $703,614 - $864,000
4
Beds
3
Baths
3,160
Sq Ft
$250/Sq Ft
Est. Value
About This Home
This home is located at 4 Romeo Ln, Biddeford, ME 04005 and is currently estimated at $790,154, approximately $250 per square foot. 4 Romeo Ln is a home located in York County with nearby schools including John F Kennedy Memorial School, Biddeford Primary School, and Biddeford Intermediate School.
Ownership History
Date
Name
Owned For
Owner Type
Purchase Details
Closed on
Aug 26, 2020
Sold by
Anton Peter C and Anton Joleen P
Bought by
Leblanc Donald L and Leblanc Elizabeth A
Current Estimated Value
Home Financials for this Owner
Home Financials are based on the most recent Mortgage that was taken out on this home.
Original Mortgage
$343,200
Outstanding Balance
$303,181
Interest Rate
2.9%
Mortgage Type
New Conventional
Estimated Equity
$486,973
Create a Home Valuation Report for This Property
The Home Valuation Report is an in-depth analysis detailing your home's value as well as a comparison with similar homes in the area
Home Values in the Area
Average Home Value in this Area
Purchase History
| Date | Buyer | Sale Price | Title Company |
|---|---|---|---|
| Leblanc Donald L | -- | None Available | |
| Leblanc Donald L | -- | None Available | |
| Leblanc Donald L | -- | None Available |
Source: Public Records
Mortgage History
| Date | Status | Borrower | Loan Amount |
|---|---|---|---|
| Open | Leblanc Donald L | $343,200 | |
| Closed | Leblanc Donald L | $343,200 |
Source: Public Records
Tax History Compared to Growth
Tax History
| Year | Tax Paid | Tax Assessment Tax Assessment Total Assessment is a certain percentage of the fair market value that is determined by local assessors to be the total taxable value of land and additions on the property. | Land | Improvement |
|---|---|---|---|---|
| 2024 | $7,602 | $534,600 | $184,800 | $349,800 |
| 2023 | $6,973 | $531,500 | $181,700 | $349,800 |
| 2022 | $7,060 | $430,200 | $104,600 | $325,600 |
| 2021 | $6,630 | $363,700 | $90,100 | $273,600 |
| 2020 | $6,123 | $329,900 | $79,500 | $250,400 |
| 2019 | $6,591 | $329,900 | $79,500 | $250,400 |
| 2018 | $2,338 | $329,900 | $79,500 | $250,400 |
| 2017 | $2,529 | $321,200 | $79,500 | $241,700 |
| 2016 | $6,379 | $321,200 | $79,500 | $241,700 |
| 2015 | $6,059 | $321,200 | $79,500 | $241,700 |
| 2014 | $5,910 | $321,200 | $79,500 | $241,700 |
| 2013 | -- | $318,900 | $82,900 | $236,000 |
Source: Public Records
Map
Nearby Homes