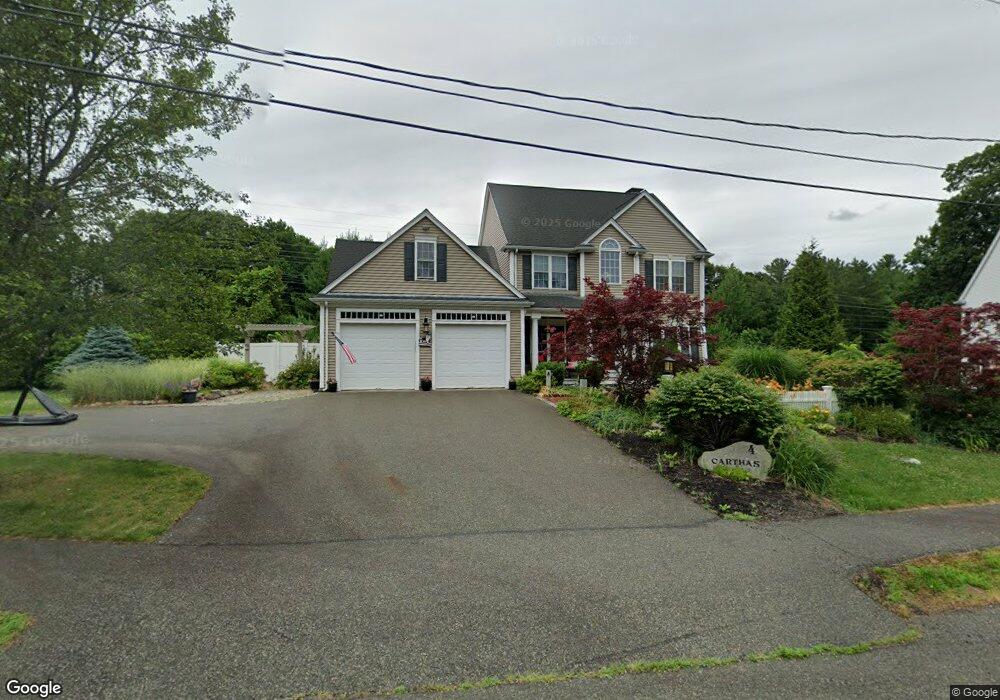
4 Rosina Way Whitman, MA 02382
Estimated Value: $694,000 - $784,000
3
Beds
3
Baths
2,067
Sq Ft
$358/Sq Ft
Est. Value
About This Home
This home is located at 4 Rosina Way, Whitman, MA 02382 and is currently estimated at $740,983, approximately $358 per square foot. 4 Rosina Way is a home located in Plymouth County with nearby schools including Beaver Brook Elementary School, Abington Middle School, and Woodsdale School.
Ownership History
Date
Name
Owned For
Owner Type
Purchase Details
Closed on
Sep 30, 2004
Sold by
Red Dog Rt and Riordan
Bought by
Carthas John S and Carthas Janice J
Current Estimated Value
Home Financials for this Owner
Home Financials are based on the most recent Mortgage that was taken out on this home.
Original Mortgage
$375,400
Interest Rate
5.81%
Mortgage Type
Purchase Money Mortgage
Create a Home Valuation Report for This Property
The Home Valuation Report is an in-depth analysis detailing your home's value as well as a comparison with similar homes in the area
Home Values in the Area
Average Home Value in this Area
Purchase History
| Date | Buyer | Sale Price | Title Company |
|---|---|---|---|
| Carthas John S | $469,900 | -- |
Source: Public Records
Mortgage History
| Date | Status | Borrower | Loan Amount |
|---|---|---|---|
| Open | Carthas John S | $350,000 | |
| Closed | Carthas John S | $215,000 | |
| Closed | Carthas John S | $100,000 | |
| Closed | Carthas John S | $375,400 |
Source: Public Records
Tax History Compared to Growth
Tax History
| Year | Tax Paid | Tax Assessment Tax Assessment Total Assessment is a certain percentage of the fair market value that is determined by local assessors to be the total taxable value of land and additions on the property. | Land | Improvement |
|---|---|---|---|---|
| 2025 | $8,200 | $625,000 | $235,200 | $389,800 |
| 2024 | $7,379 | $579,200 | $230,600 | $348,600 |
| 2023 | $7,198 | $530,400 | $200,200 | $330,200 |
| 2022 | $7,134 | $490,000 | $182,200 | $307,800 |
| 2021 | $6,975 | $450,000 | $167,600 | $282,400 |
| 2020 | $6,863 | $433,000 | $159,700 | $273,300 |
| 2019 | $6,589 | $428,400 | $159,700 | $268,700 |
| 2018 | $5,881 | $388,300 | $150,700 | $237,600 |
| 2017 | $5,856 | $388,300 | $150,700 | $237,600 |
| 2016 | $5,757 | $369,300 | $142,800 | $226,500 |
| 2015 | $5,503 | $352,500 | $126,000 | $226,500 |
Source: Public Records
Map
Nearby Homes