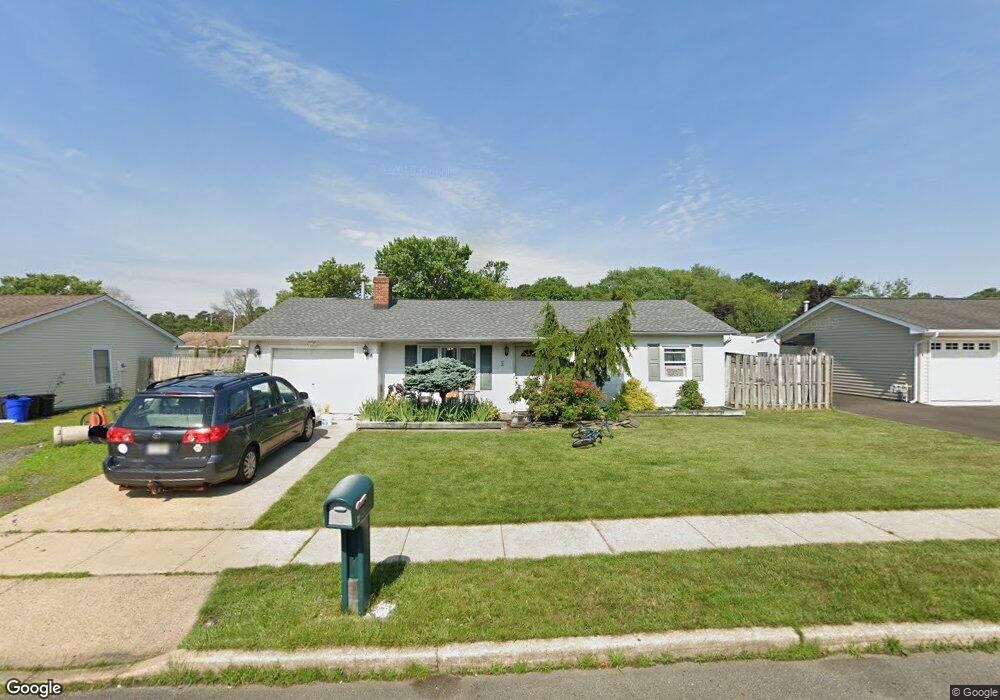
4 Roxbury Dr Barnegat, NJ 08005
Barnegat Township NeighborhoodEstimated Value: $385,000 - $397,000
2
Beds
1
Bath
1,164
Sq Ft
$336/Sq Ft
Est. Value
About This Home
This home is located at 4 Roxbury Dr, Barnegat, NJ 08005 and is currently estimated at $390,769, approximately $335 per square foot. 4 Roxbury Dr is a home located in Ocean County with nearby schools including Barnegat High School.
Ownership History
Date
Name
Owned For
Owner Type
Purchase Details
Closed on
Nov 7, 2008
Sold by
Easton Christopher and Easton Jaime
Bought by
Easton Jaime
Current Estimated Value
Home Financials for this Owner
Home Financials are based on the most recent Mortgage that was taken out on this home.
Original Mortgage
$202,492
Outstanding Balance
$132,592
Interest Rate
6.03%
Mortgage Type
FHA
Estimated Equity
$258,177
Purchase Details
Closed on
Aug 30, 2004
Sold by
Dircks Howard
Bought by
Easton Christopher and Easton Jaime
Home Financials for this Owner
Home Financials are based on the most recent Mortgage that was taken out on this home.
Original Mortgage
$193,850
Interest Rate
6.08%
Mortgage Type
FHA
Purchase Details
Closed on
Jan 18, 2002
Sold by
Vitale John
Bought by
Dircks Howard
Home Financials for this Owner
Home Financials are based on the most recent Mortgage that was taken out on this home.
Original Mortgage
$113,906
Interest Rate
7.13%
Create a Home Valuation Report for This Property
The Home Valuation Report is an in-depth analysis detailing your home's value as well as a comparison with similar homes in the area
Home Values in the Area
Average Home Value in this Area
Purchase History
| Date | Buyer | Sale Price | Title Company |
|---|---|---|---|
| Easton Jaime | -- | Old Republic National Title | |
| Easton Christopher | $202,000 | Fidelity National Title Insu | |
| Dircks Howard | $125,000 | -- |
Source: Public Records
Mortgage History
| Date | Status | Borrower | Loan Amount |
|---|---|---|---|
| Open | Easton Jaime | $202,492 | |
| Closed | Easton Christopher | $193,850 | |
| Previous Owner | Dircks Howard | $113,906 |
Source: Public Records
Tax History Compared to Growth
Tax History
| Year | Tax Paid | Tax Assessment Tax Assessment Total Assessment is a certain percentage of the fair market value that is determined by local assessors to be the total taxable value of land and additions on the property. | Land | Improvement |
|---|---|---|---|---|
| 2025 | $5,475 | $183,900 | $98,500 | $85,400 |
| 2024 | $5,353 | $183,900 | $98,500 | $85,400 |
| 2023 | $5,180 | $183,900 | $98,500 | $85,400 |
| 2022 | $5,180 | $183,900 | $98,500 | $85,400 |
| 2021 | $5,157 | $183,900 | $98,500 | $85,400 |
| 2020 | $5,133 | $183,900 | $98,500 | $85,400 |
| 2019 | $5,057 | $183,900 | $98,500 | $85,400 |
| 2018 | $5,019 | $183,900 | $98,500 | $85,400 |
| 2017 | $4,936 | $183,900 | $98,500 | $85,400 |
| 2016 | $4,835 | $183,900 | $98,500 | $85,400 |
| 2015 | $4,682 | $183,900 | $98,500 | $85,400 |
| 2014 | $4,563 | $183,900 | $98,500 | $85,400 |
Source: Public Records
Map
Nearby Homes